How to set figure size of a seaborn plot in Python
 By Avinash Kachare
In this tutorial, we learn here how to set the figure size of a seaborn plot in Python. To set the figure size of seaborn you need to know what is seaborn.
Seaborn is a Python data visualization library based on a matplotlib.
Let’s see how we can set the figure size in pandas.
Download the data files for practice.
Set figure size of a seaborn plot in Python
import pandas as pd
import numpy as np
import matplotlib.pyplot as plt
import seaborn as sns
data = pd.read_csv("Sample_submission.csv")
print(data)
sns.set_style("Whitegride")
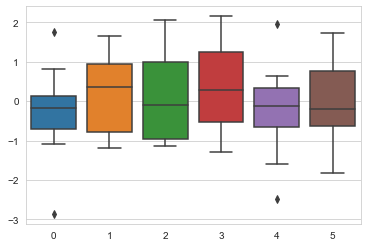
data=np.random.normal(size=(20,6))
sns.boxplot(data=data)
Explanation:
In this example, with the help of seaborn, we create a standard graph of our data. In the seaborn, there have five preset themes. They are each suited to a different application.
Here I set a white gride theme style for our seaborn graph and for setting our data figure size here we take numpy random normal function for set seaborn figure size.
And using the boxplot function that data we can see in the seaborn graph with we given the size of the figure. You can see the output of code in the output section.
output:
I hope you like my article comment if you have any doubts or suggest regarding this article.
Also read:
Leave a Reply