How to Box plot visualization with Pandas and Seaborn
 By Avinash Kachare
In this tutorial, we will learn How To Box plot visualization with Pandas and Seaborn.
How to make Box Plot in pandas
For this, there has one way to plot boxplot using the panda’s data frame is to use a boxplot() function that is part of the panda’s library.
Here I give you Datasheet for You can download File and practice by your self using this code.
# Import the required library
import pandas as pd
import numpy as np
import matplotlib.pyplot as plt
# load the data sheet
df = pd.read_csv('train.csv')
# display 5 rows of dataset
df.head()
# Box Plot visualization MSSubClass with Pandas
plt.boxplot(df['MSSubClass'])
plt.show()
output:

How to make Box Plot with seaborn in Python
# Box Plot visualization MSSubClass with Seaborn
import seaborn as sns
sns.set(color_code=True)
sns.distplot(df['MSSubClass'],bins=10)
plt.xticks(range(0,200,25))
plt.show()
output:
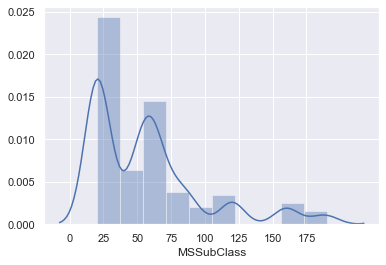
Explanation: In the above explanation we first imported module three important modules to plot a graph i.e. numpy, matplotlib.pyplot and seaborn, then taking data from the datasheet and take MSSubClass column for Box Plot Visualization of pandas with boxplot() function and seaborn with distplot() function. As you can see its results in output there I am giving you the link of output graph.
You may also read:
Leave a Reply