Set or Change the Size of a Figure in Matplotlib with Python
 By Sachin Rastogi
In this article, we need some basic concept of two python module named as “Matplotlib” and “Numpy”. The main motto of this article is how to change or set the size of a figure in Matplotlib using Python. The matplotlib module is used to create a figure, and we can do different types of experiment with that figure such as “changing the axis of the graph”, “changing the geometric shape”, “changing the background colour of the figure” and many more.
Setting or Changing the Size of a Figure in Matplotlib Python
In this article, we have to only focus on changing the size of the figure.
There is a method of changing the size of a figure in matplotlib by using “figsize=(a,b)” attribute, where “a = width of the figure in unit inches” and “b = height of the figure in unit inches”. Let us understand by some examples:-
- In this example we see the default drawn figure(width = height) :-
If we don’t use the property to change or set the size of figure, then it takes width and height both same and the result will be a square type figure.
Square size figure in Matplotlib with Python
import matplotlib.pyplot as plt
import numpy as np

X = np.array([1,2,3,4,5])
Y = X**2

plt.plot(X,Y)
plt.show()
Output :-
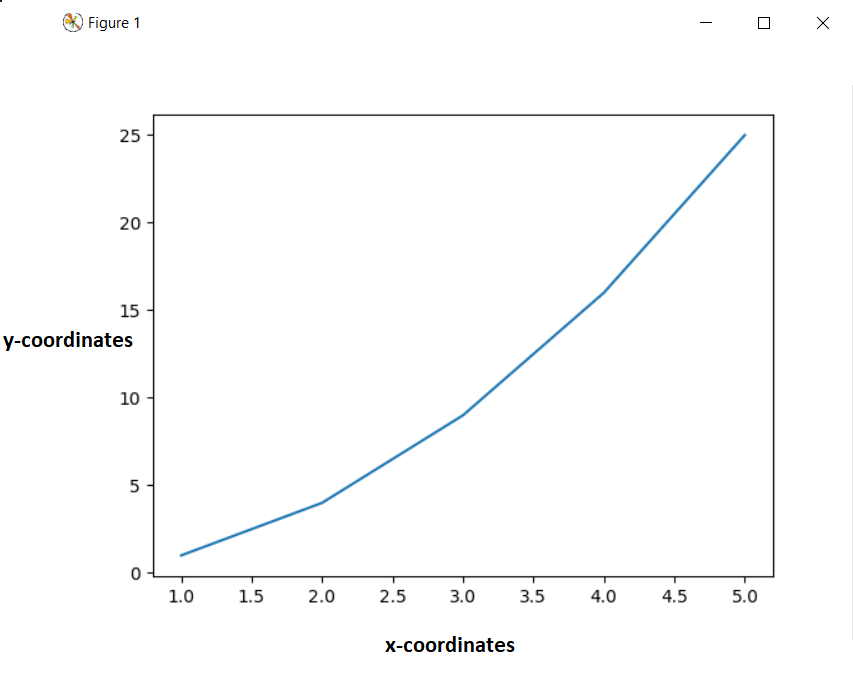
Now, you can see that the width and height of the figure are equal.
Here, the first thing we have to do is to import two python module “matplotlib” and “numpy” by these line of codes:-
- import matplotlib.pyplot as plt
- import numpy as np
and then we created a numpy array and then established the relation between X and Y i.e. (Y = X**2). Then we used the plot method to plot the graph between X and Y, and show method to show the figure.
- In this example we change the width and height of the figure(width > height):–
Rectangular shape of figure in Matplotlib with Python
Let say we want to set the width of the figure to 6 inches and height to 2 inches. This change will make the figure in the shape of something like rectangular shape.
import matplotlib.pyplot as plt
import numpy as np

fig= plt.figure(figsize=(6,2))

X = np.array([1,2,3,4,5])
Y = X**2

plt.plot(X,Y)
plt.show()
Output:-
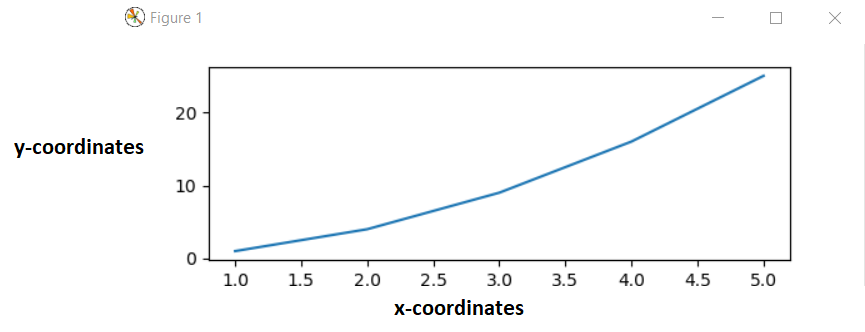
Now, you can see that the width of the figure is triple times the height of the figure.
Here, the first thing we have to do is to import two python module “matplotlib” and “numpy” by these line of codes :-
- import matplotlib.pyplot as plt
- import numpy as np
and then we created a variable named as fig and set it to the, “fig = plt.figure(figsize=(6,2))“. This will create an object named figure, which takes two tuple value in it, first one is for width in inches and second one is for height in inches. Then we created a numpy array and then established the relation between X and Y i.e. (Y = X**2). Then we used the plot method to plot the graph between X and Y, and show method to show the figure.
- In this example again we change the width and height of the figure(width < height):–
Let say we want to set the width of the figure to 2 inches and height to 6 inches. Again this change will make the figure in the shape of something like a rectangular shape.
import matplotlib.pyplot as plt
import numpy as np
fig= plt.figure(figsize=(2,6))
X = np.array([1,2,3,4,5])
Y = X**2
plt.plot(X,Y)
plt.show()
Output:-
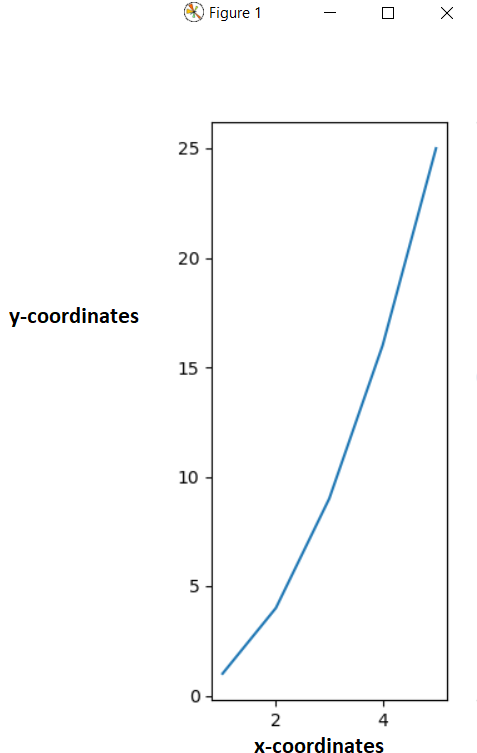
Now, you can see that the width of the figure is 1/3rd the height of the figure.
The explanation is same as stated in the above examples, the only thing that is changed is the value of width and height. In this example, width = 2 inch and height = 6 inch.
Change the size of subplots in Matplotlib
- Similarly, you can also set the size of subplots:–
import matplotlib.pyplot as plt
import numpy an np

fig, axes= plt.subplots(nrows=2, ncols=1,figsize=(8,4))

X = np.array([1,2,3,4,5])
Y = X**2

axes[0].plot(X,Y)
axes[1].plot(X,Y)

plt.tight_layout()
plt.show()
Output:-

In this example, the no. of rows = 2 and no. of columns = 1, so there are two rows and one column.
That’s all about how to change or set the size of figure in matplotlib using Python.
You can also read this article:-
Leave a Reply