How to set axis range in Matplotlib Python
 By Sachin Rastogi
In this article we need basic concept of some module of python such as “Matplotlib” and “Numpy”. In this article we are going to understand how to set the axis range of any graph in matplotlib using python. Let say we have to plot some graph in matplotlib which have x-axis and y-axis coordinate, let say x-axis extends from 0 to 10 and y-axis extends according to the relation between x and y. But we want to modify the range of x and y coordinates, let say x-axis now extends from 0 to 6 and y-axis now extends to 0 to 25 after modifying.
Setting axis range in matplotlib using Python
We can limit the value of modified x-axis and y-axis by using two different functions:-
- set_xlim() :- For modifying x-axis range
- set_ylim() :- For modifying y-axis range
These limit functions always accept a list containing two values, first value for lower bound and second value for upper bound. This limit the coordinates between these two values.
Let us understand it with some example.
For modifying x-axis range
Let say we have to create a plot of x-coordinates of 0 to 10 and y-coordinates be the cube of each of these x-coordinates. We then modify the x-coordinates from 0 to 6.
- Before modification in x-coordinates:-
import matplotlib.pyplot as plt
import numpy as np

# creating an empty object

a= plt.figure()

# adding axes

axes= a.add_axes([0.1,0.1,0.8,0.8])

x= np.arange(0,11)

axes.plot(x,x**3, marker='*')

plt.show()
Output :-

- After modification in x-coordinates :-
import matplotlib.pyplot as plt
import numpy as np

# creating an empty object

a= plt.figure()

axes= a.add_axes([0.1,0.1,0.8,0.8])

# adding axes

x= np.arange(0,11)

axes.plot(x,x**3, marker='*')

axes.set_xlim([0,6])

plt.show()
Output:-

Explanation:-
Here, the first thing we have to do is to import two python module “matplotlib” and “numpy” by these line of codes :-
- import matplotlib.pyplot as plt
- import numpy as np
Then we create a variable named “a” and set its value to plt.figure().
This creates a figure object, which is initially empty, because we haven’t inserted anything in it. Then add axes to this figure. We then have our x-coordinates that ranges from 0 to 10. We then plot the cube of x-coordinates.
Now set the limit of the x coordinates from 0 to 6 using the “set_xlim()” function. Again, this function takes in a list composed of 2 values. The first value is the lower limit and the second value is the upper limit.
Then we show the figure with the show() function.
For modifying y-axis range
Similarly, we have to create a plot of x-coordinates of 0 to 10 and y-coordinates be the cube of each of these x-coordinates. We then modify the y-coordinates from 0 to 25.
- Before modification in x-coordinates :- Same as stated in uppercase for x-coordinates.
- After modification in y-coordinates :-
import matplotlib.pyplot as plt
import numpy as np

# creating an empty object

a= plt.figure()

axes= a.add_axes([0.1,0.1,0.8,0.8])

# adding axes

x= np.arange(0,11)

axes.plot(x,x**3, marker='*')

axes.set_ylim([0,25])

plt.show()
Output :-
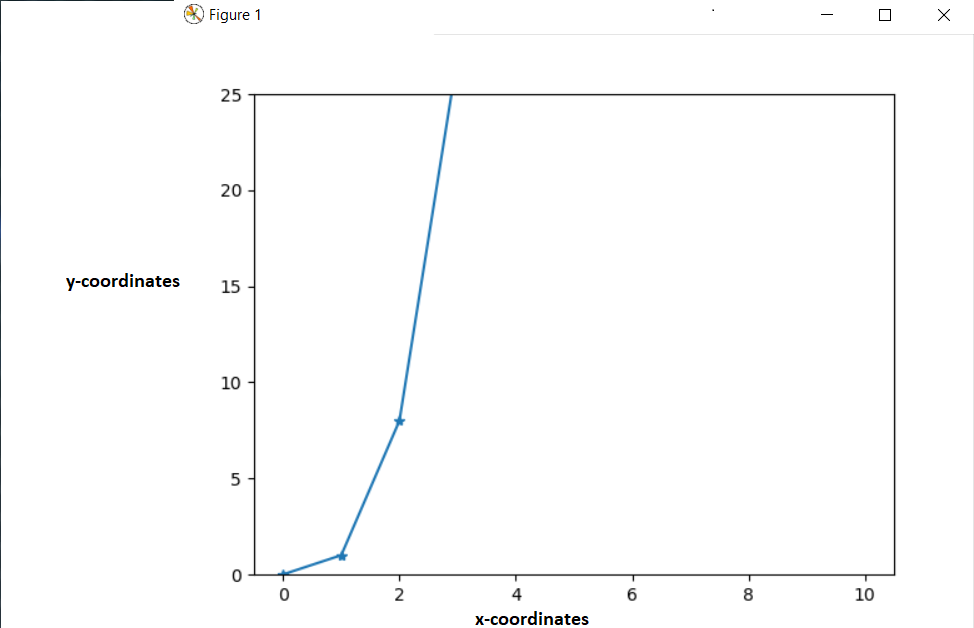
Here, for limiting y-coordinates we used the function “set_ylim()” and passed 2 values, first for lower limit and second for upper limit.
set axis range in Matplotlib Python: After modifying both x-axis and y-axis coordinates
import matplotlib.pyplot as plt
import numpy as np

# creating an empty object
a= plt.figure()

axes= a.add_axes([0.1,0.1,0.8,0.8])

# adding axes

x= np.arange(0,11)

axes.plot(x,x**3, marker='*')

axes.set_xlim([0,6])

axes.set_ylim([0,25])

plt.show()
Output:-

You can also read these articles:-
Leave a Reply