How to change line color in matplotlib
 By Aashish Rahate
In this tutorial, we will learn how to change line color and other attributes in matplotlib in python.
Using matplotlib we can implement various types of graphs such as bar graph, pie chart, scatter graph, etc. But we will focus on the line graph for the sake of simplicity. There are also various markers you can use to show lines or points. You can change the colors of markers, points, and lines using this method.
Changing the color of lines in matplotlib
There are many ways by which you can change line color in matplotlib python.
First, make sure that matplotlib is installed.
The keyword arguments (**kwargs) are used to change the colors.
- First import the matplotlib library.
import matpplotlib.pyplot as plt
- Using the plt.plot method type the points or lines that you want to plot.
import matplotlib.pyplot as plt plt.plot([1,2,3,4,5,6]) plt.ylabel('numbers') plt.show() - In the brackets, if you don’t mention the line color as shown above; by default, it chooses the blue color.

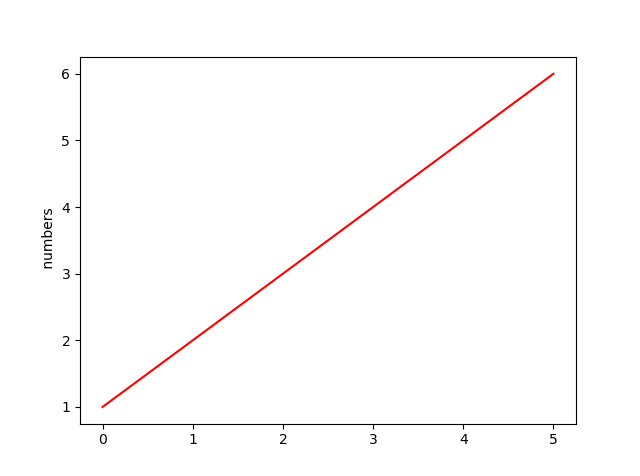
- You can change the color by using full names color=”red”.
plt.plot([1,2,3,4,5,6], color='red')
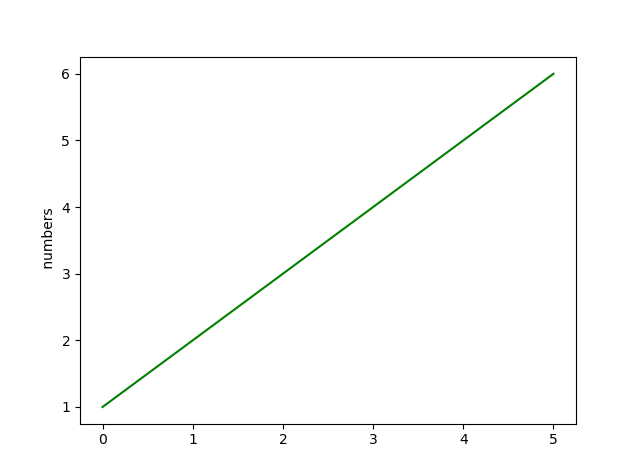
- You can change the color by using hex strings (‘#008000’).
plt.plot([1,2,3,4,5,6],'#008000')
- By using the RGB or RGBA tuples ((0,1,0,1)).
- Another way is by using grayscale intensities as a string (‘0.8’).
- By simply mentioning the initials of the colors. (“b” = blue, “r”= red, “g”= green, “c”= cyan, “m”= magenta, “y”= yellow, “k”= black, “w”= white.)
plt.plot([1,2,3,4,5,6], 'y')

NOTE: make sure when typing the full name or initials, write then in the single inverted commas. (‘ ”).
you should also visit:
Awesome bro ,
What I need is exactly in this content thank u so much….
Thanks! This was so helpful. Continue the good work.