How to Plot Complex Numbers in Python
 By Aashish Rahate
In this tutorial, we will learn to plot the complex numbers given by the user in Python 3 using matplotlib package. Here we will plot the complex numbers as scatter graph.
Now I know you are here because you are interested in Data Visualization using Python, hence you’ll need this awesome trick to plot the complex numbers. These numbers you’ll take as the separate real and imaginary parts from the user.
First, make sure that the IDE you are working on has matplotlib installed. The command to install matplotlib via the prompt is ‘pip install matplotlib’. This will install the dependencies on your computer. You can also install ANACONDA to use the matplotlib.
Plotting the complex numbers in Python
Steps to plot the complex numbers in Python 3:
- Import the matplotlib library.
- Take the number of points to be plotted as input from the user.
- Create two empty lists. One for the real part and other for the imaginary part.
- Make a for loop to append the real and imaginary parts of the number in the lists.
- Use library methods to define the colors, label, marker, etc.
- Give labels to the axes and the whole graph.
- Show the plotted points.
import matplotlib.pyplot as plt
numb = int(input("enter no. of points to be plotted : "))
x = []
y = []
for jack in range(0, numb):
    re = float(input("enter the real part: "))
    im = float(input('enter the imaginary part: '))
    x.append(re)
    y.append(im)
plt.scatter(x, y, label="star", marker="*", color="green", s=30)
plt.xlabel('real axis')
plt.ylabel('imaginary axis')
plt.title('complex numbers')
plt.legend()
plt.show()
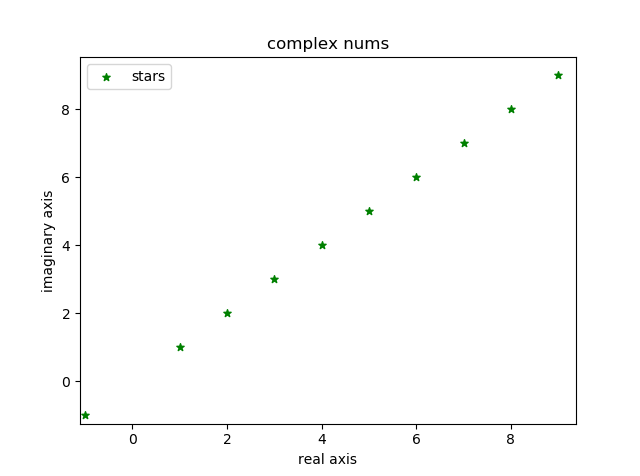
OUTPUT:
enter no. of points to be plotted : 10
enter the real part: 1
enter the imaginary part: 1
enter the real part: 2
enter the imaginary part: 2
enter the real part: 3
enter the imaginary part: 3
enter the real part: 4
enter the imaginary part: 4
enter the real part: 5
enter the imaginary part: 5
enter the real part: 6
enter the imaginary part: 6
enter the real part: 7
enter the imaginary part: 7
enter the real part: 8
enter the imaginary part: 8
enter the real part: 9
enter the imaginary part: 9
enter the real part: -1
enter the imaginary part: -1
import matplotlib.pyplot as plt
numb = int(input(“enter no. of points to be plotted : “))
x = []
y = []
for jack in range(0, numb):
re = float(input(“enter the real part: “))
im = float(input(‘enter the imaginary part: ‘))
x.append(re)
y.append(im)
plt.scatter(x, y, label=”star”, marker=”*”, color=”green”, s=30)
plt.xlabel(‘real axis’)
plt.ylabel(‘imaginary axis’)
plt.title(‘complex numbers’)
plt.legend()
plt.show()