Python program to draw a pie chart that shows the daily activity
 By Bipin Kumar
In this tutorial, we will see how to draw a pie chart that shows the daily activity in Python. A pie chart represents numbers in percentages, and the total sum of all segments needs to equal 100%. The user will provide one list of daily activity and another list that show the time taken to do each activity and by using these lists we have to draw a pie chart by using the Python programming language. To solve this problem, we will use the matplotlib library. So, before going to solve this problem we will learn a little bit about matplotlib and their installation process.
What is matplotlib in Python?
Matplotlib is a widely used visualization library in Python for a 2D plot of arrays. By using this library, you can generate plots, histograms, bar charts, pie charts, scatterplots, etc., with just a few lines of code.
Installation:-
To install matplotlib package on your command prompt just use the pip.
pip install matplotlib
Draw a pie chart that shows the daily activity in Python
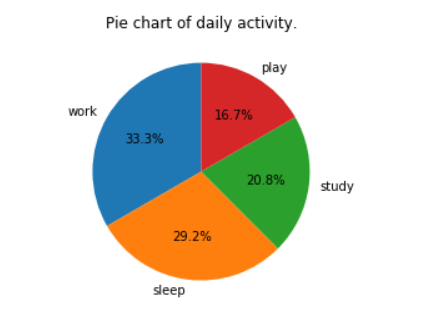
Let’s assume A is the list that contains the daily activity and list B show the time taken to complete the daily activity.
A=[‘work’, ‘sleep’, ‘study’, ‘play’]
B=[8,7,5,4]
Python program:-
import matplotlib.pyplot as plt
A=['work', 'sleep', 'study', 'play']
B=[8,7,5,4]
plt.pie(B, labels=A,autopct = '%1.1f%%')
plt.title('Pie chart of daily activity.')
plt.show()
Here, we have included the pyplot library as plt from the matplotlib package by using the import function.
Output:-
So Guy’s, I hope you find it useful.
You may also read:
Leave a Reply