Predict Next Purchase using Machine Learning in Python
 By Ashutosh Khandelwal
In this tutorial, we will learn how to Predict the Next Purchase using Machine Learning in Python programming language. Basically, by next purchase here we mean that number of items required in the coming month to sell. Every item has its unique ID number.
There are many datasets available online which we can use in our study. But specifically for this article, we will take Kaggle dataset-https://www.kaggle.com/c/competitive-data-science-predict-future-sales/overview. It has details of items with their prices and dates on which it is sold in a shop with shop ID also given. And here we will predict the overall count required of a particular item next month.
There are many learning algorithms for predicting the next purchase. But for this, tutorial we will use the RNN LSTM model to get a good accuracy score for our purchase.
Used Libraries for this program:
- Pandas
- Numpy
- Matplotlib
- Seaborn
Python program to Predict Next Purchase using Machine Learning
We will use the Jupyter notebook for making our model.
import pandas as pd
import numpy as np
import matplotlib.pyplot as plt
import seaborn as sns
We will start with importing libraries
default_path = '../input/'
!ls ../input
train_df = pd.read_csv(default_path+'sales_train.csv')
items_df = pd.read_csv(default_path+'items.csv')
test_df = pd.read_csv(default_path+'test.csv')
Then we will upload the necessary CSV files using the pandas library.
train_df['date'] = pd.to_datetime(train_df['date'], format='%d.%m.%Y')
This will convert the argument i.e. string to DateTime format.
dataset = train_df.pivot_table(index=['item_id', 'shop_id'],values=['item_cnt_day'], columns='date_block_num', fill_value=0)
dataset = dataset.reset_index()
dataset = pd.merge(test_df, dataset, on=['item_id', 'shop_id'], how='left')
dataset = dataset.fillna(0)
dataset = dataset.drop(['shop_id', 'item_id', 'ID'], axis=1)
X_train = np.expand_dims(dataset.values[:, :-1], axis=2)
y_train = dataset.values[:, -1:]

X_test = np.expand_dims(dataset.values[:, 1:], axis=2)
y_test = dataset.values[:, :1]
This will align the data in the required form in a table which we will import use in our model.
from keras.models import Sequential
from keras.layers import LSTM, Dense, Dropout
Then we will import our open-source Keras library which has.
model = Sequential()
model.add(LSTM(units=64, input_shape=(33, 1)))
model.add(Dropout(0.3))
model.add(Dense(1))

model.compile(loss='mse',
              optimizer='adam',
              metrics=['mean_squared_error'])
Now we made a model with the LSTM layer and which uses ‘adam’ optimizer.
history = model.fit(X_train, y_train, batch_size=4096, epochs=10)
Then we will fit the data in the model containing the LSTM layer.

plt.plot(history.history['loss'], label= 'loss(mse)')
plt.plot(np.sqrt(history.history['mean_squared_error']), label= 'rmse')
plt.legend(loc=1)
Now we will plot the model data using plt.plot().

LSTM_prediction = model.predict(X_test)
LSTM_prediction = LSTM_prediction.clip(0, 20)
submission = pd.DataFrame({'ID': test_df['ID'], 'item_cnt_month': LSTM_prediction.ravel()})
submission.to_csv('submission.csv',index=False)
In the end, we will input our test data to the model and will get predicted LSTM data and make the dataframe using pandas and convert that data to dataframe using .to_csv. We refer to the next purchase here as the number of items required in the coming month. You can provide any data which you want to predict to model and get the CSV output file as we have done in the test set.
OUTPUT FILE: submission.csv
CSV file image:
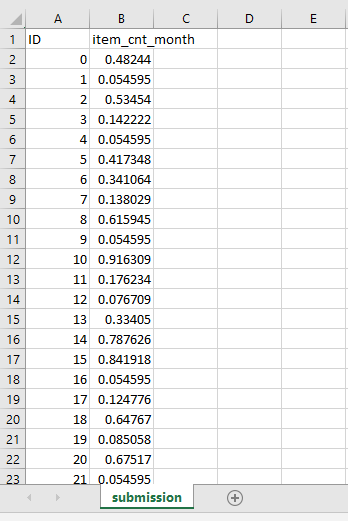
This is the output file of our dataset. That’s it!
Leave a Reply