Sales Forecasting using Walmart Dataset using Machine Learning in Python
 By Yash Gandhi
Forecasting means to predict the future. Forecasting is used to predict future conditions and making plans accordingly. In our daily life, we are using a weather forecast and plan our day activity accordingly. Forecasting is used in many businesses. Here we will learn Sales Forecasting using Walmart Dataset using Machine Learning in Python.
Sales forecasting
Sales forecasting or predicting the future is very important for every business. It is used for companies to making plans for high revenue, keep costs lower and high efficiency. Companies made short-term and long term future planning as per forecasting data. Based on past data with some assumption which predict future trends and draw their budget accordingly.
There are many factors like Market changes, Product changes, Economic conditions, season changes, etc; which impact to forecast of sales. Companies can make a plane to meet future demands and make improvements in their sales by keeping in mind these various factors.
Sales forecasting using Machine learning
Here, we use the dataset of Walmart sales to forecast future sales using machine learning in Python. Linear regression use to forecast sales. Numpy, Pandas, Sklearn, Scipy, Seaborn Python libraries used in this program. We implement in three steps first to import libraries second by using that libraries prepare data and third forecast.
Step-1 First, importing libraries of Python.
#importing libraries
import numpy as np
import pandas as pd
import matplotlib.pyplot as plt
from sklearn.model_selection import train_test_split
from sklearn.linear_model import LinearRegression
from scipy.special import boxcox1p
import seaborn as sns
Step-2 Now, we preparing data. Here we perform four tasks:
- Get the data from .csv file.
- Merging the data.
- Analyze the data.
- Manipulating the data.
1. Getting data from .csv file
#Getting data
features=pd.read_csv("features.csv")
store=pd.read_csv("stores.csv")
train=pd.read_csv("train.csv")
test=pd.read_csv("test.csv")
2. Take important information and merging the data
From train.csv, taking groupby Store, Date and sum Weekly_Sales.
#reseting train
train=train.groupby(['Store','Date'])['Weekly_Sales'].sum()
train=train.reset_index()
train.head(10)
Output: 
Merging train and features data by inner join.
#merging train and feature
data=pd.merge(train,features,on=['Store','Date'],how='inner')
data.head(10)
Output:- 
Merging Data and Store on Store by inner join.
#marging store with data
data=pd.merge(data,store,on=['Store'],how='inner')
data.head(10)
Output:- 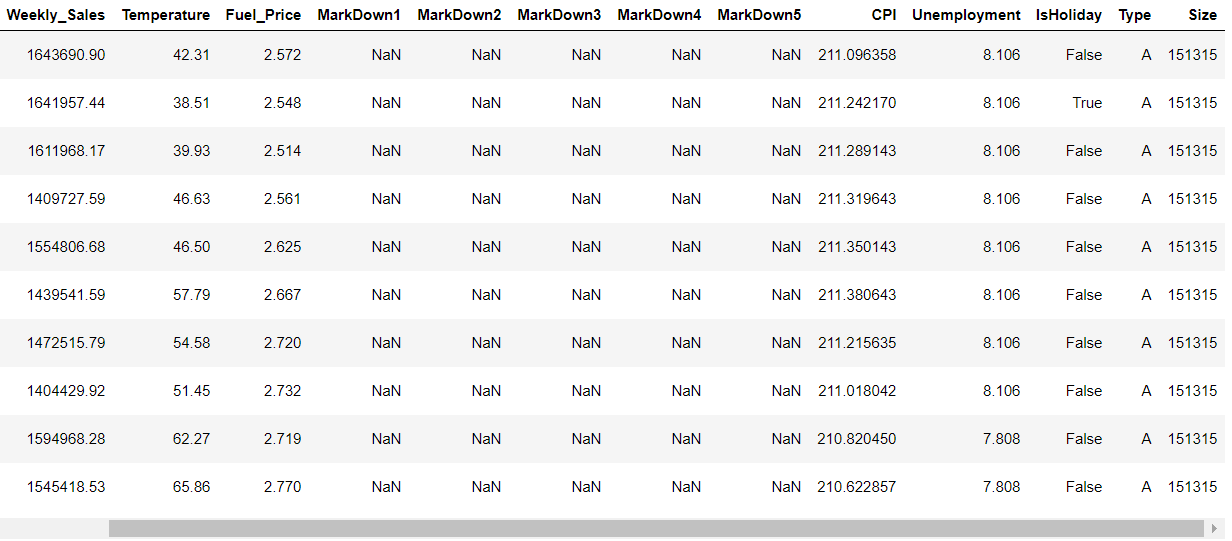
sorting the data by date.
#sorting values of Data
data=data.sort_values(by='Date')
data.head(10)
Output:- 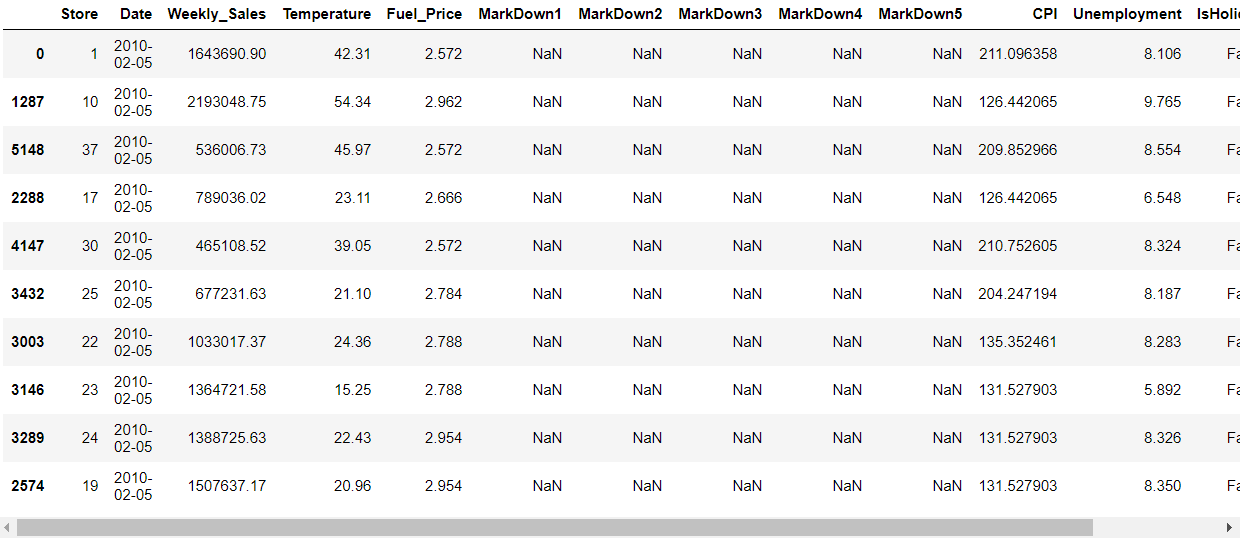
3. Analyzing the data
Here, we see different methods to analyze data.
Count plot of Type.
sns.countplot(x="Type", data=data)
Output:- 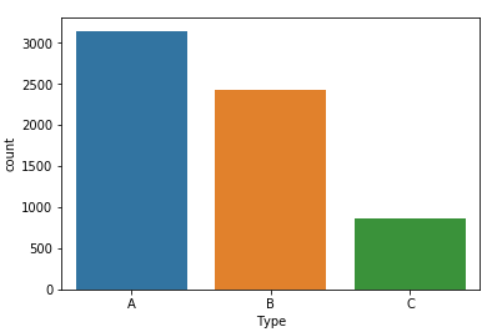
Box plot of Type and Weekly_Sales
sns.boxplot(x='Type',y='Weekly_Sales',data=data)
Output:- 
Histogram of Weekly_sales
data["Weekly_Sales"].plot.hist()
Output:- ![data["Weekly_Sales"].plot.hist()](https://www.codespeedy.com/wp-content/uploads/2020/04/O7.png)
Count plot of IsHoliday
sns.countplot(x="IsHoliday", data=data)
Output:- 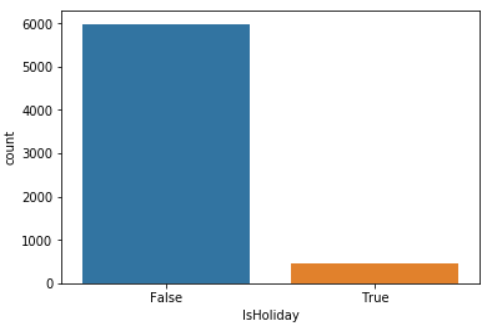
Now, we check the null values of data
data.isnull().sum()
Output:- 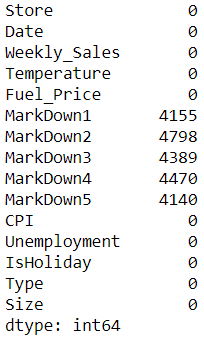
Heatmap is another representation of null values.
sns.heatmap(data.isnull(),yticklabels=False, cmap="viridis")
Output:- 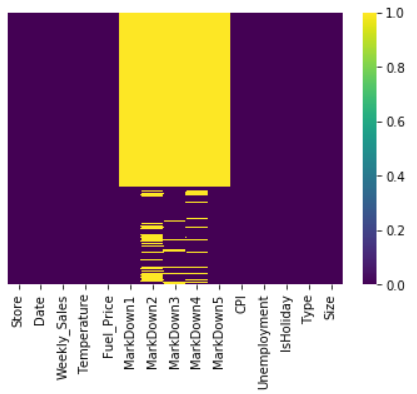
4. Manipulating data. Transform data into useful information and deleting unnecessary items. Getting the final data.
Removing the unnecessary columns.
data=data.drop(['MarkDown1','MarkDown2','MarkDown3','MarkDown4','MarkDown5'],axis=1)
data.head(10)
Output:- 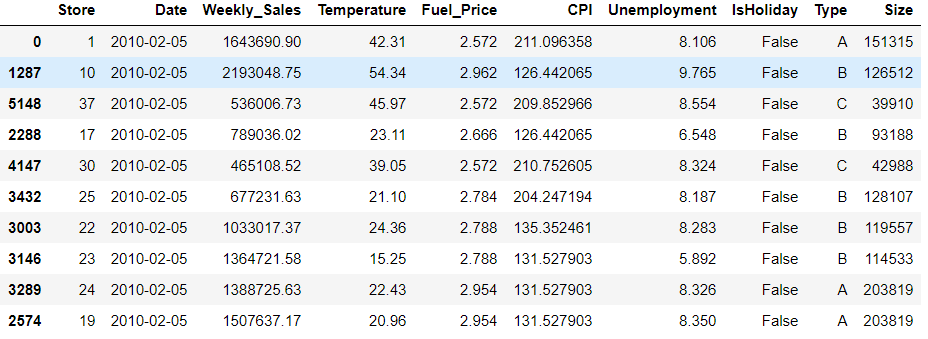
Again checking for null values and verify that data is clean.
data.isnull().sum()
Output:- 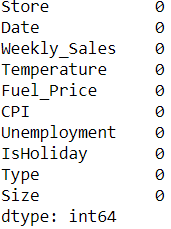
Heatmap for verifying there are no null values in data.
sns.heatmap(data.isnull(),yticklabels=False, cmap="viridis")
Output:- 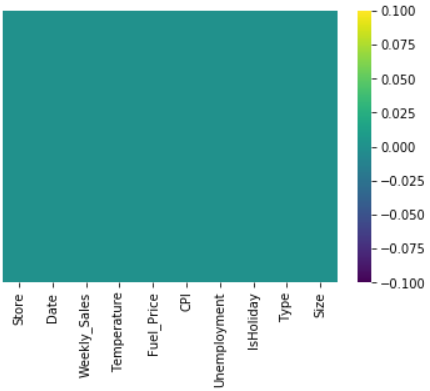
Converting IsHoliday in Holiday which is integer and 1 for holiday and 0 otherwise.
data['Holiday']=[int(i) for i in list(data.IsHoliday)]
data.head(10)
Output:- ![data['Holiday']=[int(i) for i in list(data.IsHoliday)]](https://www.codespeedy.com/wp-content/uploads/2020/04/O14.png)
Converting type to an integer by one-hot encoding. The first column is also removed because we know of both columns B and C are 0 then it is A-type. So B=1 and C=0 for B.B=0 and C=1 for C.B=0 and C=0 for A.
Type_dummy=pd.get_dummies(data['Type'],drop_first=True)
Type_dummy.head(10)
Output:- ![Type_dummy=pd.get_dummies(data['Type'],drop_first=True)](https://www.codespeedy.com/wp-content/uploads/2020/04/O15.png)
Concating type_dummy with data.
data=pd.concat([data,Type_dummy],axis=1)
data.head(10)
Output:- ![data=pd.concat([data,Type_dummy],axis=1)](https://www.codespeedy.com/wp-content/uploads/2020/04/O16.png)
We only use integer so we removing non-integer columns after transforming it into integer form.
data=data.drop(['Type','IsHoliday'],axis=1)
data.drop(10)
Output: ![data=data.drop(['Type','IsHoliday'],axis=1)](https://www.codespeedy.com/wp-content/uploads/2020/04/O17.png)
Step-3 Now, we perform learning tasks on this data in four steps.
- Splitting the train and test data.
- Applying linear regression.
- Predicting the value
- Evaluate the model
1. Splitting data into train and test data. The size of the test data is 30%.
#splitting data in input and output
X=data.drop(['Weekly_Sales','Store','Date'],axis=1)
y=data['Weekly_Sales']
X_train,X_test,y_train,y_test=train_test_split(X,y,test_size=0.3)
2. Applying linear regression and fit the training data into it.
LR=LinearRegression(normalize=True)
LR.fit(X_train,y_train)
3. Predicting the data for test value as per linear regression.
y_pred=LR.predict(X_test)
plt.plot(y_test,y_pred,'ro')
plt.plot(y_test,y_test,'b-')
plt.show()
Output:- 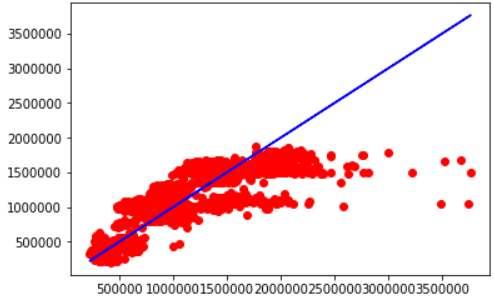
4. Evaluating the model by calculating errors by the root mean square error and R -squared.
Root_mean_square_error=np.sqrt(np.mean(np.square(y_test-y_pred)))
print(Root_mean_square_error)
Output:-![]()
from sklearn.metrics import r2_score
r2=r2_score(y_test,y_pred)
print(r2)
Output:-
Now, if we want to predict the weekly sales. Then we give particular tuple to input in the model and predict the weekly sales as output. Here I’m showing an example of that.
prediction=LR.predict(pd.DataFrame([(40.37,2.876,173.325456,7.934,103464,0,0,0)]))
print(prediction)
Output:- ![]()
Dataset
The dataset we are using is Walmart dataset for sales forecasting. A dataset is available at Kaggle. You can download it from here: Walmart-dataset
In this dataset, there are four following .csv files.
- features.csv
- stores.csv
- train.csv
- test.csv
Conclusion
In conclusion, the forecast should use for better plans and get more benefit from it. Here we get the following topics.
- Sale Forecasting
- Sale forecasting using machine learning in Python.
Leave a Reply