Logistics Regression in python
 By Purnendu Das
Hi, today we are going to learn about Logistic Regression in Python. It is strongly recommended that you should have knowledge about regression and linear regression. Please watch this post – Fitting dataset into Linear Regression model .
What is Logistic Regression
Basically, Regression divided into 3 different types.
- Linear Regression
- Logistic Regression
- Polynomial Regression
So, Logistic regression is another type of regression. Regression used for predictive analysis. It is used for building a predictive model. Regression creates a relationship (equation) between the dependent variable and independent variable. In logistic regression, the outcome will be in Binary format like 0 or 1, High or Low, True or False, etc. The regression line will be an S Curve or Sigmoid Curve. The function of sigmoid is ( Y/1-Y). So we can say logistic regression is used to get classified output.
Difference between Linear Regression and Logistic Regression
Linear Regression Graph
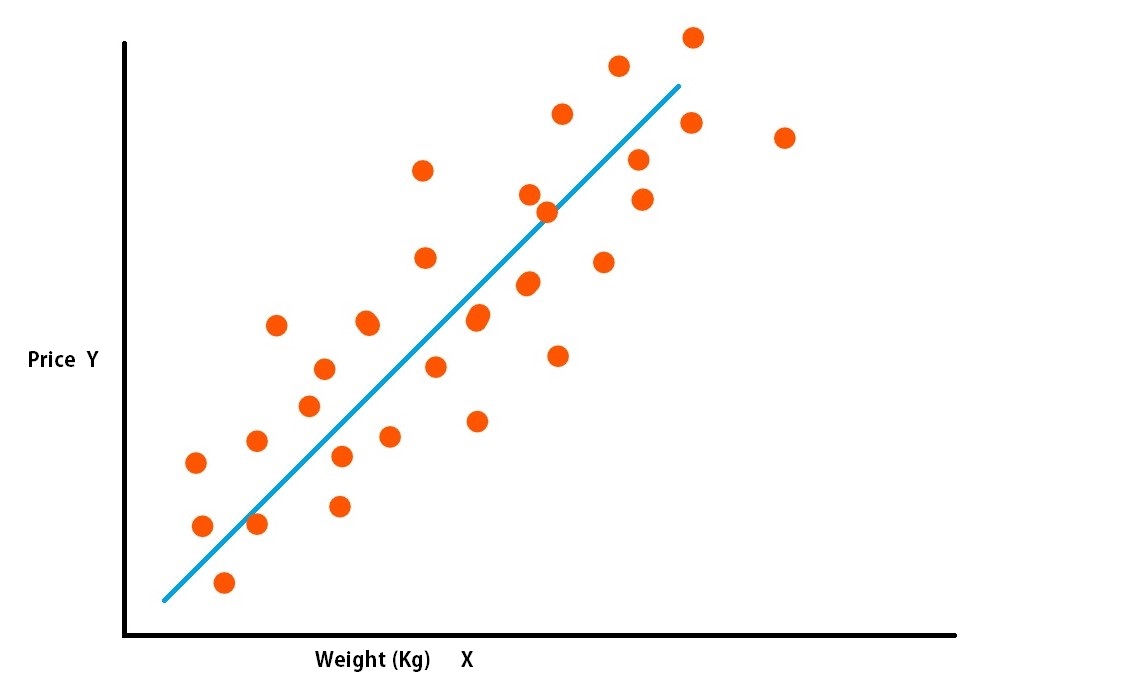
Linear regression graph
Logistic Regression Graph
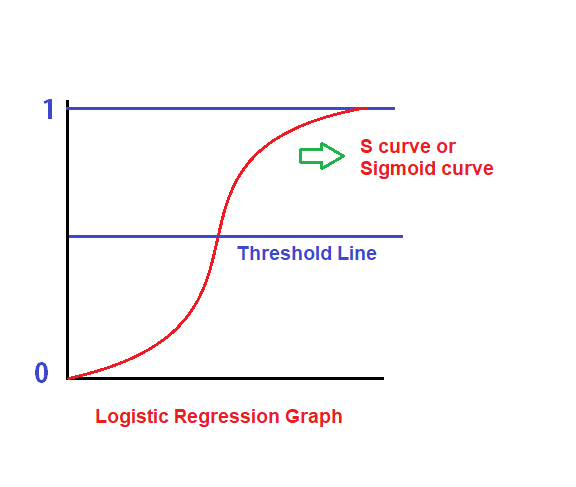
Logistic Regression Graph
In Linear Regression: We used continuous data of Y.
In Logistic Regression: We used discrete or binary data of Y.
In Linear Regression: Outcome will be a decimal value.
In Logistic Regression: Outcome will be classified or binary like True Or False, High or Low, etc.
In Linear Regression: Regressor will be a straight line.
In Logistic Regression: Regressor line will be an S curve or Sigmoid curve.
In Linear Regression: Follows the equation: Y= mX+C.
In Logistic Regression: Follows the equation: Y= e^x + e^-x .
In Linear Regression: Example: House price prediction, Temperature prediction etc.
In Logistic Regression: Example: car purchasing prediction, rain prediction, etc.
The basic theoretical part of Logistic Regression is almost covered. Let’s see how to implement in python.
Logistic Regression in Python
We are going to predict if a patient will be a victim of Heart Diseases.
Here we use a dataset from Kaggle.
Dataset Name is: “framingham.csv”
This is a Heart diseases records.
In this data set values are in 2 different types :
- Continuous: Real value
- Binary: “1”, means “Yes”, “0” means “No”
This dataset’s column details are:
- male : male or female
- age: Age of the patient
- currentSmoker : whether or not the patient is a current smoker
- cigsPerDay : the number of cigarettes that the person smoked on average in one day
- BPMeds : whether or not the patient was on blood pressure medication
- prevalentStroke : whether or not the patient had previously had a stroke
- prevalentHyp: whether or not the patient was hypertensive
- diabetes: whether or not the patient had diabetes
- totChol: total cholesterol level
- sysBP : systolic blood pressure
- diaBP : diastolic blood pressure
- BMI: Body Mass Index
- heartRate : heart rate
- glucose : glucose level
- TenYearCHD : 10-year risk of coronary heart disease
Required Library:
- Numpy Library
- Pandas Library
- Sklearn Library
Let’s go for the code:
import numpy as np
import pandas as pd

data = pd.read_csv("framingham.csv") #importing the dataset
data.sample(5)
Output:
Dataframe output Image:
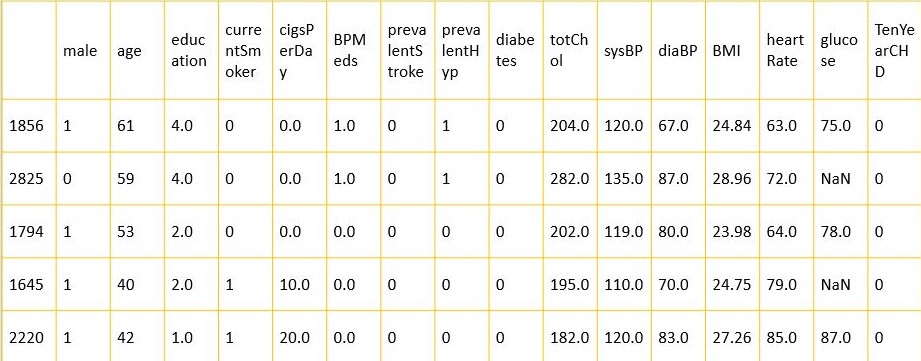
Explain:
Here we import Pandas and Numpy library and also import the “framingham.csv” dataset and stored into the data variable as a pandas dataframe.
data.drop(['education'],axis=1,inplace=True) # removing the 'education' column
data.shape # checking the shape
Output:
(4238, 15)
Explain:
Here we remove the “education” column. It is unnecessary for the prediction.
And we check the shape of the dataframe.
data.isnull().sum() #checking if any null value present
Output:
data.dtypes #checking the data types
Output:
Explain:
Here we check which column has which data type. It is necessary to make all column to numeric for fitting any model. Here all are in Numeric data type, which is good for us.
data['cigsPerDay'] = data['cigsPerDay'].astype(dtype='int64')
data['BPMeds'] = data['BPMeds'].astype(dtype='int64')
data['totChol'] = data['totChol'].astype(dtype='int64')
data['heartRate'] = data['heartRate'].astype(dtype='int64')
data['glucose'] = data['glucose'].astype(dtype='int64')

data.dtypes #checking the data types
Output:
male                 int64
age                  int64
currentSmoker        int64
cigsPerDay           int64
BPMeds               int64
prevalentStroke      int64
prevalentHyp         int64
diabetes             int64
totChol              int64
sysBP              float64
diaBP              float64
BMI                float64
heartRate            int64
glucose              int64
TenYearCHD           int64
dtype: object
Explain:
We changed many columns’ data type as the integer for our prediction. It is not mandatory.
X = data.iloc[:,0:-1] # All columns except last one as X
y = data.iloc[:,-1] # Only last column as y
Explain:
We make an X variable and put all columns, except the last one. And we make y variable and put only last column.
from sklearn.model_selection import train_test_split
X_train,X_test,y_train,y_test = train_test_split(X,y,test_size=.30,random_state=1) #splitting the data as train and test
X_train.shape
X_test.shape
Output:
(2624, 14)
(1125, 14)
Explain:
Here we splitting the X and y into X_train, X_test and y_train,y_test. Into 70:30 ratio. And we check the shape of them.
from sklearn.linear_model import LogisticRegression
l_reg = LogisticRegression() # Making a logistic regression model
l_reg.fit(X_train,y_train) # Fitting the data
Explain:
We make a l_reg logistic regression model. And we fit the X_train & y_train data.
y_pred = l_reg.predict(X_test) # Predict the X_test data
from sklearn import metrics
metrics.accuracy_score(y_test,y_pred) # calculate the accuracy
Output:
Explain:
Here we predict the X_test data and store into the y_pred variable. Then we check the accuracy score.
We got accuracy score as 0.8497777777777777 means almost 85% accurate prediction which is pretty good. Thank you.
The whole program is available here: Logistics regression( Download from here )
You can also like to read:
Sorry Purnendu Das, but actually the performance of the model is mostly bad. The accuracy score wont help this time due to the fact that the dataset is actually unbalanaced. It is necessary to do a ROC and AUC score to really understand what is going on.