First Machine Learning Project in Python Step-By-Step
 By Yash Gandhi
The best way to learn machine learning in Python by making small projects. Here, we take a small example of the machine learning project of linear regression. Before starting the project let understand machine learning and linear regression.
Machine learning
In simple terms, Machine learning is the process in which machines (like a robot, computer) learns the things/algorithms to perform some tasks based on previous experience. Machine learning used in various places for example Tumor detection, Self-driving car, Recommendation system, etc. There are mainly three types of machine learning.
- Supervised learning
- Unsupervised learning
- Reinforcement learning.
Linear regression
Linear regression is a technique of supervised learning. It is a statistical approach to find the relationship between variables. Linear regression mostly used for prediction.
Making project in Machine learning
Here we make a project of linear regression. We make this project in four steps.
- Implement libraries
- reading the data
- Visualizing the data
- Building the model
Step – 1 Implementing libraries
First, we need to import the necessary libraries of Python. Here, we use Pandas, Numpy, Sklearn libraries of python.
Numpy: Numpy is a Python package used for scientific calculation, for example performing different operations on matrix.
Sklearn: Sklearn is a Python package used for performing different machine learning operations, for example predicting the unknown future values.
Pandas: Pandas is a Python package used as a data analysis tool, easy use of data-structure, for example, Dataset can easily be analyzed by the plot.
import pandas as pd
import numpy as np
import matplotlib.pyplot as plt
from sklearn.linear_model import LinearRegression
from sklearn.metrics import r2_score
Step – 2 Reading the data
Here use one .csv file with random data. instead of this random data use the dataset.
data=pd.read_csv('Sales.csv')
data
Output:

Step – 3 Visualizing the data
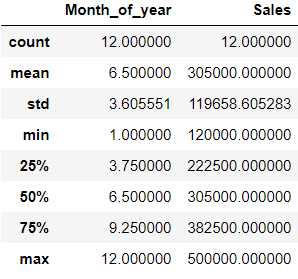
Describing the data by describe function.
data.describe()
Output:
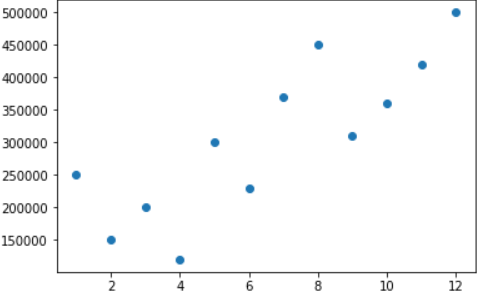
The graph between sales and month of the year.
plt.scatter(data['Month_of_year'],data['Sales'])
Output:
Step – 4 Building the model
Splitting the data in input and target value.
X=data[['Month_of_year']]
y=data['Sales']
Making a linear regression model and fitting data into it.
model=LinearRegression()
model.fit(X,y)
Prediction by model
y_pred=model.predict(X)
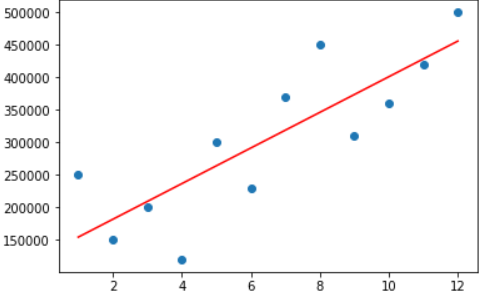
A plot of linear regression.
plt.scatter(X,y)
plt.plot(X,y_pred,color='Red')
Output:
Evaluating the model by computing the R square score.
r2_score(y,y_pred)
Output:
![]()
Now, we predict the sales for 7.5 months by this model.
print(model.predict([[7.5]]))
Output:
![]()
Dataset
Dataset used here is a random dataset created by me. You can also use another dataset. You can download a dataset from here: Sales.csv
Conclusion
With the help of this small project easily understand the following:
- Machine learning
- Linear regression
For many other projects or other important matters use of Machine learning and linear regression easy way analyze, predict, and get the result with accuracy.
Leave a Reply