Anomaly detection in Python using scikit-learn
 By Prakhar Gupta
Hello users, this article is for using scikit-learn model for anomaly detection in Python.
Introduction to Anomaly Detection
Anomaly = Outliers = Unusual Data Point
Whenever data generating process behaves unusually, it produces an outlier. Anomaly detection is the process of detecting and excluding outliers from a given dataset. The real-world challenge faced in anomaly detection is to essentially define the construction of the right model to separate outliers from noise.
An outlier can be defined as a set of data that deviates from the average of the data set. Furthermore, it indicates a measurement error.
Methods
- Density-based
- DBSCAN
- LOF
- Distance-based
- K-NN
- K-Means
For our outlier detection model, we use Density-Based Spatial Clustering of Applications with Noise (DBSCAN) in Python.
DBSCAN
DBSCAN is an Unsupervised method that divides the data points into specific batches, such that the data points in the same batch have similar properties, whereas data points in different batches have different properties.
The idea to use the DBSCAN algorithm is that for each data point in a cluster, the neighbourhood of a given radius(eps) has to contain at least a minimum number of points.
DBSCAN algorithm requires a parameter-
- eps: It defines the surrounding of a datapoint, if the distance between two points is lower or equal to ‘eps’ then they are considered as neighbours. All the points outside this neighbourhood are considered as outliers. The right way to find the ‘eps’ value is based on k-distance graph.
Here we use the DBSCAN library from the scikit-learn package for anomaly detection.
To know more about DBSCAN, click here.
Example of Anomaly Detection using Sci-kit Learn in Python
First of all, we import the required libraries.
import sklearn
from sklearn.datasets import make_moons
from sklearn.cluster import DBSCAN
import matplotlib.pyplot as plt
%matplotlib inline
Loading the dataset and likewise representing in 2-D array.
df, label = make_moons(n_samples = 250, noise = 0.2)
df[0:4]
Now we make the DBSCAN model and later fit the model.
cluster = DBSCAN(eps = 0.3, min_samples= 15)
cluster.fit(df)
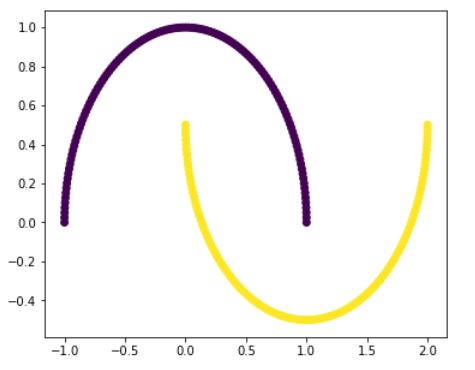
Plotting the clusters.
fig, ax = plt.subplots(figsize=(6,5))
ax.scatter(df[:,0], df[:,1], c=cluster.labels_)
fig.show()
Output
We obtain the following cluster.

The ‘purple‘ colored data points which are far away from the moon-shaped clusters are known as Outliers
While taking a cluster without considering Noise, the following cluster is obtained(a line) without any outliers.
Leave a Reply