Python Matplotlib Library
 By Shravan Reddy
In this tutorial, we will see how to use the Matplotlib library to plot some graphs which are commonly used in Machine Learning. As well as see examples on each of the functions.
Now let us get to know a few things about this library:
- It is a python package for plotting that generates production quality graphs.
- Produces hardcopy formats and interactive environments across platforms.
- It can be used in python scripts, Ipython shell, Jupyter notebook, web application servers.
pyplot module consists of various commands such as plot(), hist(), bar(), pie(), boxplot() as well as subplot(). Hence is a powerful tool to construct and visualize data.
we will go through each command and see the results of these commands.
Python Matplotlib Library plot function
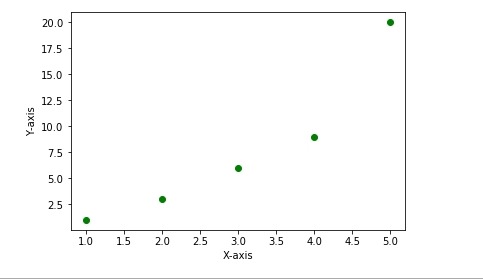
plot function takes x list and y list as inputs and plots the graph if we mention only one input by default it acts as y list
import matplotlib.pyplot as plt
plt.plot([1,2,3,4,5],[1,3,6,9,20],'go')
plt.xlabel("X-axis")
plt.ylabel("Y-axis")
plt.show()
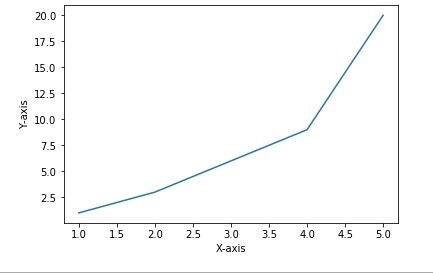
import matplotlib.pyplot as plt
plt.plot([1,2,3,4,5],[1,3,6,9,20])
plt.xlabel("X-axis")
plt.ylabel("Y-axis")
plt.show()
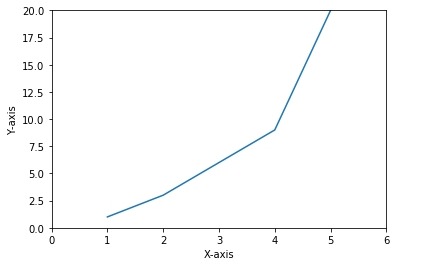
import matplotlib.pyplot as plt
plt.plot([1,2,3,4,5],[1,3,6,9,20])
plt.axis([0,6,0,20])  # if we want to plot axis.
plt.xlabel("X-axis")
plt.ylabel("Y-axis")
plt.show()
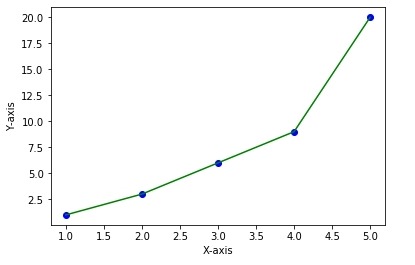
import matplotlib.pyplot as plt
plt.plot([1,2,3,4,5],[1,3,6,9,20],'bo')
plt.plot([1,2,3,4,5],[1,3,6,9,20],'g')
plt.xlabel("X-axis")
plt.ylabel("Y-axis")
plt.show()
import matplotlib.pyplot as plt
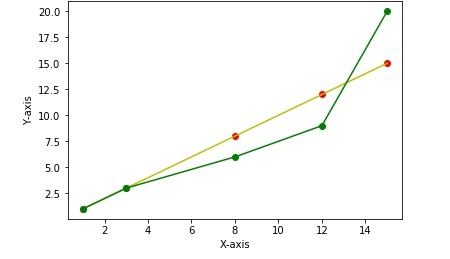
plt.plot([15,12,8,3,1],[15,12,8,3,1],'ro')
plt.plot([15,12,8,3,1],[15,12,8,3,1],'y') #here we are trying to use multiple same function but different features
plt.plot([1,3,8,12,15],[1,3,6,9,20],'go')
plt.plot([1,3,8,12,15],[1,3,6,9,20],'g')
plt.xlabel("X-axis")
plt.ylabel("Y-axis")
plt.show()
import matplotlib.pyplot as plt
plt.plot([15,12,8,3,1],[15,12,8,3,1],'r^')
plt.plot([15,12,8,3,1],[15,12,8,3,1],'y')
plt.plot([1,3,8,12,15],[1,3,6,9,20],'go') # here we are trying different labels as well as different symbol
plt.plot([1,3,8,12,15],[1,3,6,9,20],'g')
plt.xlabel("Cost")
plt.ylabel("Quantity")
plt.show()

Explanation
Now let us understand the above code. In the first line, we are importing library and next line we are using it by passing three arguments the first is x-list and then y-list and finally saying it to plot green(g) circles(o) ‘go’ you can specify anything line for triangles we use ^ symbol and change color as well.
Now if you wish to give labels to the x-axis and y-axis you can do it as shown.
Python Matplotlib Library bar function
You should have already known about bar graphs earlier, but we will see how to plot them using python modules.
This function takes similar inputs to plot x-array and y-array and tries to plot the bar graph.
import numpy as np
import matplotlib.pyplot as plt
x=np.arange(10)                  # here we are creating array from 0 to 1.
print(x)
y=np.array([5,4,6,10,8,12,15,5,1,10]) # this is the other way of creating array.
print(y)
plt.bar(x,y)
plt.show()
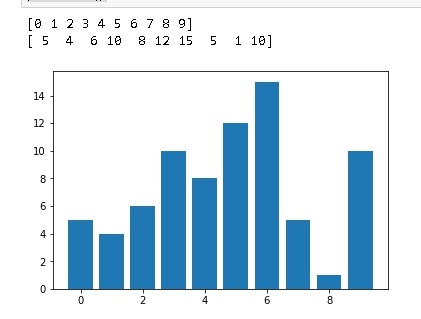
Explanation
Here we have to pass two array arguments to the bar function so I have shown two ways of creating arrays that are by using arange function and as by array function which is found in the numpy package.
Python Matplotlib Library boxplot function
import matplotlib.pyplot as plt
x=np.arange(10)
print(x)
y=np.array([5,4,6,10,8,12,15,5,1,10])
print(y)
plt.axis([0,10,0,15])
plt.boxplot(x)
plt.boxplot(y)
plt.show()

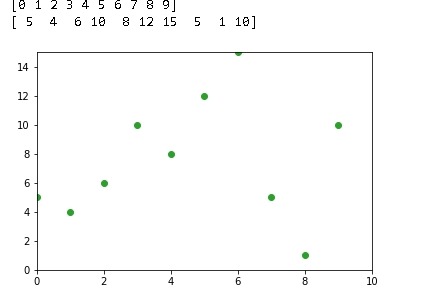
Python Matplotlib Library scatter function
import matplotlib.pyplot as plt
x=np.arange(10)
print(x)
y=np.array([5,4,6,10,8,12,15,5,1,10])
print(y)
plt.axis([0,10,0,15])
plt.scatter(x,y)
plt.show()
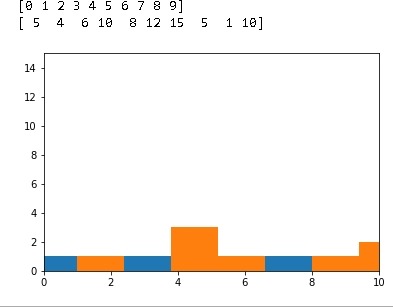
Python Matplotlib Library hist function
import matplotlib.pyplot as plt
x=np.arange(10)
print(x)
y=np.array([5,4,6,10,8,12,15,5,1,10])
print(y)
plt.axis([0,10,0,15])
plt.hist(x)
plt.hist(y)
plt.show()
Histogram of an image using matplotlib in Python
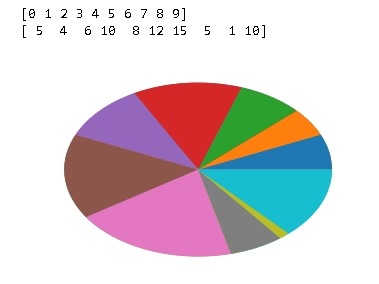
Pie function
The pie graphs are circular statistical data interpretations which are divided into percentage slices. And hence a great way to represent data and visualize data.
import matplotlib.pyplot as plt
x=np.arange(10)
print(x)
y=np.array([5,4,6,10,8,12,15,5,1,10])
print(y)
plt.axis([0,10,0,15])
plt.pie(x)
plt.pie(y)
plt.show()
Python program to draw a pie chart that shows the daily activity
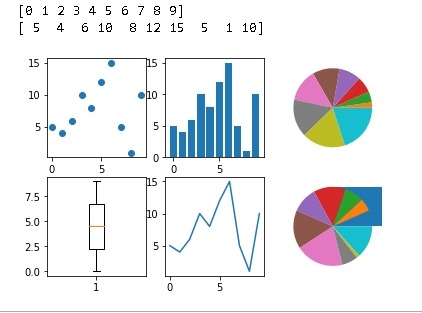
Subplot function
import matplotlib.pyplot as plt
x=np.arange(10)
print(x)
y=np.array([5,4,6,10,8,12,15,5,1,10])
print(y)
plt.axis([0,10,0,15])
plt.subplot(231)
plt.scatter(x,y)
plt.subplot(232)
plt.bar(x,y)
plt.subplot(233)
plt.pie(x)
plt.subplot(234)
plt.boxplot(x)
plt.subplot(235)
plt.plot(x,y)
plt.subplot(236)
plt.hist(x)
plt.show()
Conclusion
Finally, we are done with these basic library functions for plotting and analyzing the graphs.
Leave a Reply