Pretty Print of a pandas DataFrame in Python
 By Kovid Bhatt
This text is for you to know the methods of designing a pretty print of a pandas DataFrame in Python. When you program a pandas DataFrame and want the output of your pandas DataFrame program to look pretty. Then you may use the methods discussed in this tutorial. There are various functions for making a pretty print of a pandas DataFrame in Python.
Pandas DataFrame: Pretty Print
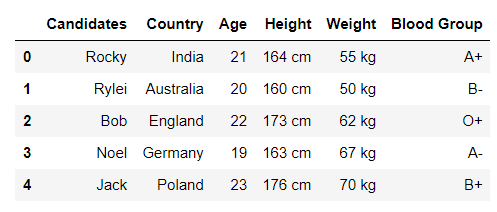
An example of a normal pandas DataFrame is given below:
# import the library as instructed below
import pandas as pd
# create data
raw_data={'Candidates':['Rocky','Rylei','Bob','Noel','Jack'],
'Country':['India','Australia','England','Germany','Poland'],
'Age':['21','20','22','19','23'],
'Height':['164 cm','160 cm','173 cm','163 cm','176 cm'],
'Weight':['55 kg','50 kg','62 kg','67 kg','70 kg'],
'Blood Group':['A+','B-','O+','A-','B+']}
# Pandas DataFrame
DataFrame=pd.DataFrame(raw_data)
# print the DataFrame
print(DataFrame)
Output:

Display():
In the example above you can produce a pretty print of the Pandas DataFrame by simply using the display() command for printing the DataFrame as shown below.
# import the library as instructed below
import pandas as pd
# create data
raw_data={'Candidates':['Rocky','Rylei','Bob','Noel','Jack'],
'Country':['India','Australia','England','Germany','Poland'],
'Age':['21','20','22','19','23'],
'Height':['164 cm','160 cm','173 cm','163 cm','176 cm'],
'Weight':['55 kg','50 kg','62 kg','67 kg','70 kg'],
'Blood Group':['A+','B-','O+','A-','B+']}
# Pandas DataFrame
DataFrame=pd.DataFrame(raw_data)
# pretty print of the DataFrame
display(DataFrame)
Output:
pd.set_option():
Other than using the display() method you may use the pd.set_option() method to precisely change the print of the DataFrame in Python. These methods have been discussed below.
display.max_rows:
This display option of pretty print of a pandas DataFrame is used to showcase the highest number of rows you want in your DataFrame. If you set the display.max_rows to None then all the rows will be printed as it is.
display.max_columns:
This display option of pretty print of a pandas DataFrame is used to showcase the highest number of columns you want in your DataFrame. If you set the display.max_columns to None then all the columns will be printed as it is.
display.colheader_justify:
This display option is very useful in adjusting the position of the headers of the columns in the pretty print of a pandas DataFrame. You may set its value to center, left, or right.
display.width:
This display option helps set the width of the DataFrame in characters. If this value is set to None then the pandas library automatically sets the width according to the DataFrame.
display.precision:
This display option controls the number of numerical digits after decimal in any numeric value in the pandas DataFrame.
Pretty Print of a Pandas Dataframe: Example 1
Here is an example using all the display options above.
# import the library as instructed below
import pandas as pd
# create data
raw_data={'Candidates':['Rocky','Rylei','Bob','Noel','Jack'],
'Country':['India','Australia','England','Germany','Poland'],
'Age':['21','20','22','19','23'],
'Height':['164 cm','160 cm','173 cm','163 cm','176 cm'],
'Weight':['55 kg','50 kg','62 kg','67 kg','70 kg'],
'Blood Group':['A+','B-','O+','A-','B+']}
# Pandas DataFrame
DataFrame=pd.DataFrame(raw_data)
# display options
pd.set_option('display.max_columns',None)
pd.set_option('display.max_rows',2)
pd.set_option('display.width',None)
pd.set_option('display.colheader_justify','right')
# pretty print of the DataFrame
display(DataFrame)
Output:

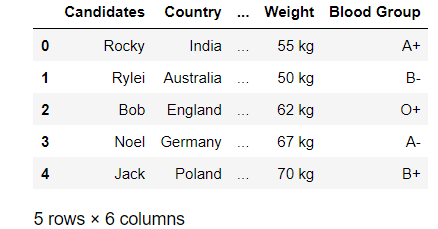
Example 2:
# import the library as instructed below
import pandas as pd
# create data
raw_data={'Candidates':['Rocky','Rylei','Bob','Noel','Jack'],
'Country':['India','Australia','England','Germany','Poland'],
'Age':['21','20','22','19','23'],
'Height':['164 cm','160 cm','173 cm','163 cm','176 cm'],
'Weight':['55 kg','50 kg','62 kg','67 kg','70 kg'],
'Blood Group':['A+','B-','O+','A-','B+']}
# Pandas DataFrame
DataFrame=pd.DataFrame(raw_data)
# display options
pd.set_option('display.max_columns',4)
pd.set_option('display.max_rows',None)
pd.set_option('display.width',None)
pd.set_option('display.colheader_justify','center')
# pretty print of the DataFrame
display(DataFrame)
Output:
Leave a Reply