Analyzing US Economic Dashboard in Python
 By Neelesh Biswas
This tutorial will guide us in learning how to analyze US economic dashboard in Python.
Taking out the information from a given data & displaying it is one of the important parts of data science and people can make decisions based on the observed information. In this article, we will try to extract two of the most essential economic indicators i.e., GDP & Unemployment of US from a given data which is stored in a .csv (Comma-Separated Values) file, & then display them in a Dashboard.
You may read: how to create dataframe in Python using pandas
GDP and its implementation in Data Science
Before we proceed in bringing out the information, let us know about GDP. Gross Domestic Product (GDP) is a factor that determines how well the economy of a region is doing by measuring the market value of all the goods and services produced in a specific time period. It is often measured annually & the economy is basically country-focused.
An economy’s performance is observed by comparing the GDP of two consecutive time periods. A decrease in GDP indicates the economy is less productive which may lead to Unemployment; on the other hand, an increase in GDP suggests the economy is performing better & can achieve Sustainable Development. In this article, we will examine how changes in GDP can affect the unemployment rate by dealing with the following points:
- Define a Function that Makes a Dashboard.
- Create a dataframe that contains the GDP data and display it.
- Create a dataframe that contains the unemployment data and display it.
- Display a dataframe where unemployment was greater than 8.5%.
- Use the function make_dashboard to make a dashboard.
NOTE: Before we proceed further in coding the whole project I want to say in this article, we are accessing a .csv file through a given URL. So while working on these kinds of Data Science Projects, I will recommend to use online Python IDEs rather than installing Pandas & Bokeh packages in your devices as the latter has a tedious process & the code I’ll discuss here may show runtime error sometimes, due to lack of packages while installing them; however the same code will run perfectly in online IDEs. One such online IDE I recommend to use is JupyterLab. To install Pandas write the following command after opening the Command Prompt if you’re using Windows
python -m pip install -U pandas
or if you’re using Linux then type the following command in your terminal.
sudo pip install pandas
after that for installing Bokeh, replace pandas with bokeh from the above two commands in your respective OSes.
Define a Function that Makes a Dashboard for US economy
a) To make the dashboard, we’ll need to define a function that will help to make it. But before that, we’ll have to import both Pandas & Bokeh.
import pandas as pd
from bokeh.plotting import figure, output_file, show,output_notebook
output_notebook()
b) Now we’ll define the function make_dashboard with five parameters: x (for naming the x-axis), gdp_change, unemployment (name of the two parameters of the same y-axis), title (for labeling the title of the dashboard) & file_name (name of the file being saved in .html file extension).
def make_dashboard(x, gdp_change, unemployment, title, file_name):
    output_file(file_name)                                                                              #name of the file
    p = figure(title=title, x_axis_label='year', y_axis_label='%')                                      #plotting the dashboard
    p.line(x.squeeze(), gdp_change.squeeze(), color="firebrick", line_width=4, legend="% GDP change")   #plotting the 'GDP' part
    p.line(x.squeeze(), unemployment.squeeze(), color="green", line_width=4, legend="% unemployed")     #plotting the 'unemployment' part
    show(p)                                                                                             #displaying the entire dashboard
c) After that, we’ll provide the URL link of the .csv file which is being accessed by a dictionary named links with two key-value pairs named GDP & Unemployment. As the two will be accessed as the columns of the .csv file, the pairs will be defined under String Characters.
links={'GDP':'https://s3-api.us-geo.objectstorage.softlayer.net/cf-courses-data/CognitiveClass/PY0101EN/projects/coursera_project/clean_gdp.csv',\
       'unemployment':'https://s3-api.us-geo.objectstorage.softlayer.net/cf-courses-data/CognitiveClass/PY0101EN/projects/coursera_project/clean_unemployment.csv'}
NOTE: Before implementing the links in the given key values, I would suggest checking the links in your internet browser to check the CSV file so that you can verify the output easily. Once you copy & paste the links in your browser, the files will be automatically downloaded by pressing the Enter button.
Create a dataframe that contains the GDP data and display the first five rows of the dataframe
A Data frame is a two-dimensional data structure, i.e., data is aligned in rows and columns. We’ll create the GDP dataframe & for displaying the first five rows of the dataframe, we use head() function.
csv_path=links["GDP"]
d1=pd.read_csv(csv_path)            #defining the dataframe
d1.head()                           #displaying first five rows of the dataframe
Output:
 Create a dataframe that contains the Unemployment data and display the first five rows of the dataframe
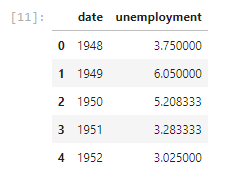
Now we create the Unemployment dataframe & display its first five rows using similar procedures just as we made in the GDP one.
csv_path1=links["unemployment"]
d2=pd.read_csv(csv_path1)                   #defining the dataframe
d2.head()                                   #displaying first five rows of the dataframe
Output:
Display a dataframe where unemployment was greater than 8.5%
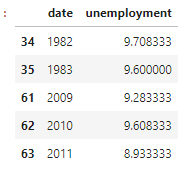
Now if you follow the codes of the third point you’ll notice I created a dataframe named d2. With the help of this dataframe, we’ll create another one to display when the unemployment is greater than 8.5%. We’ll name this dataframe as d3.
d3=d2[d2['unemployment']>8.5]                #extracting the part of the dataframe d2 to a new dataframe
d3
Output:
Use the function make_dashboard to make a dashboard
Now we’ll create the dashboard.
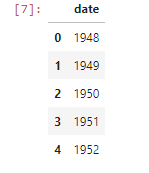
a) First we’ll create the dataframe for x-axis we’ve created for parameter x in the function. The x-axis will be the date column of the GDP .csv file (if you’ve checked the links given while defining the links dictionary in point 1(c), you’ll get this).
csv_path1=links['GDP']
gdp_dataframe1=pd.read_csv(csv_path1)
x = pd.DataFrame(gdp_dataframe1, columns=['date'])
x.head()
Output:
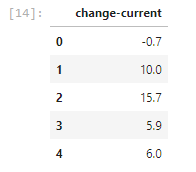
b) Now we’ll make the y-axis. For displaying the GDP part firstly, we’ll use the first five rows of “change-current” column of GDP as we did the same for x dataframe.
csv_path2=links['GDP']
gdp_dataframe2=pd.read_csv(csv_path2)
gdp_change = pd.DataFrame(gdp_dataframe2, columns=['change-current'])
gdp_change.head()
Output:
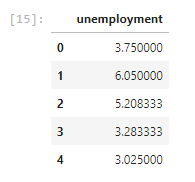
c) Similarly, we’ll use the first five rows of unemployment dataframe.
csv_path3=links['unemployment']
unemploy_dataframe1= pd.read_csv(csv_path3)
unemployment = pd.DataFrame(unemploy_dataframe1, columns=['unemployment'])
unemployment.head()
Output:
d) Now we’ll display the title of the dashboard using title parameter used in the function.
title = "Unemployment stats according to GDP"
then we’ll save the dashboard in .html file extension under file_name parameter of the function so that the file can be displayed in the cloud for future.
file_name = "index.html"
and lastly, we’ll combine all the parameters & make the dashboard given below:
make_dashboard(x=x, gdp_change=gdp_change, unemployment=unemployment, title=title, file_name=file_name)
Output:

Dear all,
Please assist in the following issue in a code:
I use online Python EDI – Sololearn, after import library I have next comment:
No module named ‘bokeh’
Please advise. Thank you in advance.
Regards,
Tim
I think you have to find out where the module bokeh.plotting can be found. Use pip to load it into your work environment. Then from the module import the functions figure, output_file, show, output_notebook.
hello!
i have a little bit error in my code ‘make_dashboard’ is not defined’ what it’s means and how to resolve it?
csv_path=links[“GDP”]
d1=pd.read_csv(csv_path) #defining the dataframe
d1.head()
Error Msg – —————————————————————————
NameError Traceback (most recent call last)
in
—-> 1 csv_path= links[“GDP”]
2 d1=pd.read_csv(csv_path) #defining the dataframe
3 d1.head() #displaying first five rows
NameError: name ‘links’ is not defined
Run the cell containing the links dictionary to initialize the variable links. Then run the cell for creating data frame for GDP
d3=d2[d2[‘unemployment’]>8.5] #extracting the part of the dataframe d2 to a new dataframe d3
Hi Team,
In above code why d2 wrote two times in syntax? Kindly advise as I m new to python programming. I am currently pursuing IBM data science course. How to learn code & syntax writing.
Thank you for your help!
d2[‘unemployment’]>8.5 returns a column containing True and False boolean values. d2[d2[‘unemployment’]] goes through the column d2 and for every true in adds the row in d3. I hope you got it.
Good evening. please am having same problem as in number 2 and 3 above.
How do I rectify it.
Thanks
Hi., I am struggling with the syntax error as in invalid syntax in the following code.
Can you please help me figure out?
x = # Create your dataframe with column datecsv_path1=links[‘GDP’]
csv_path1=links[“GDP”]
gdp_dataframe1=pd.read_csv(csv_path1)
x = pd.DataFrame(gdp_dataframe1, columns=[‘date’])
x.head()
csv_path= links[“GDP”]
2 d1=pd.read_csv(csv_path) #defining the dataframe
3 d1.head() #displaying first five rows
HTTPError:HTTP Error 404:Not Found
please help me….i am getting name error,saying that output file is not defined when calling dashboard function
Create a dataframe that contains the GDP data and display the first five rows of the dataframe
I inputted the code and received message: TypeError: ‘dict’ object is not callable. Please advise
TypeError Traceback (most recent call last)
in
1 # Type your code here
2 csv_path=links[“GDP”]
—-> 3 d1=pd.read_csv(csv_path)
4 d1.head()
TypeError: ‘dict’ object is not callable
please help me….i am getting name error,saying that output file is not defined when calling dashboard function
The code works perfectly fine for me. The only problem is that when I execute the final statement to actually display the dataframe, the graph is completely blank. Am I doing something wrong?
hallo,
how can we create a bucket in Watson studio?
make_dashboard() got an unexpected keyword argument ‘gdp_change’
After this we need to do some other steps for the analysis.. We need Bucket name of IBM CLOUD … HELP
How to download the last output of the dashboard (plot) into your computer
csv_path1=links[‘GDP’]
gdp_dataframe1=pd.read_csv(csv_path1)
x = pd.DataFrame(gdp_dataframe1, columns=[‘date’])
x.head()
File “”, line 1
x = # Create your dataframe with column date
^
SyntaxError: invalid syntax
Hola, no tengo muy claro como hacer la última parte, ya que me aparece así:
—————————————————————————
NameError Traceback (most recent call last)
in
1 # make_dashboard(x=x, gdp_change=gdpchange, unemployment=, title=, file_name=)
—-> 2 make_dashboard ( x = x, gdp_change = gdp_change, desempleo = desempleo, título = título, nombre_archivo = nombre_archivo )
NameError: name ‘make_dashboard’ is not defined