Predictive Models for Ebola using Machine Learning in Python
 By Vineet Raj
In this article, you will learn Predictive Models for Ebola using Machine Learning in Python. The Ebola virus spread according to the region and respective climate of countries. On March 23, 2014, the World Health Organization (WHO) announced that an Ebola virus revolution that began in the Republic of Guinea in December 2013 had spread to several West African countries. Preliminary data from the 2014 EVD epidemic suggest that in all cases, approximately 20% of children were less than 16 years of age, in which case mortality was 90% among children less than 1-year-old.
For the dataset, visit:kaggle/ebola-outbreak
For the CSV file, visit: Ebola dataset CSV file
Image of EBOLA virus: 
Import the libraries,
import requests
import numpy as np
import pandas as pd

from sklearn import datasets, linear_model, preprocessing
Get the data,
names = ['Indicator','Country','Date','value']
df = pd.read_csv('https://ds-ec2.scraperwiki.com/g7nnqgn/ckm9nsfssakeuor/cgi-bin/csv/ebola_data_db_format.csv',names=names,na_values='?',header=None,skiprows=1)
df = df.dropna()
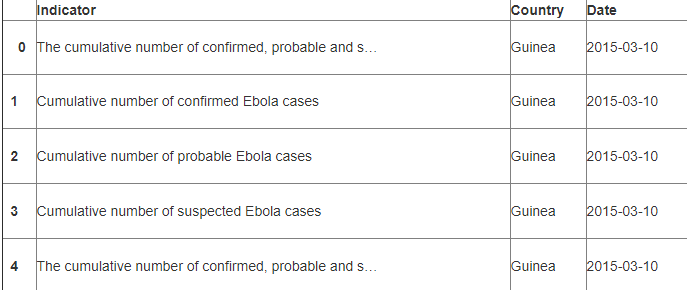
df.head(5)
df.head()
df.shape()
Output:-
array(['Guinea', 'Liberia', 'Sierra Leone', 'United Kingdom', 'Mali',
       'Nigeria', 'Senegal', 'Spain', 'United States of America', 'Italy',
       'Liberia 2', 'Guinea 2'], dtype=object)
T_Guinea=[73.0,84.0,78.5]
T_Liberia=[81.0,81.0,81.0]
T_Sierra_Leone=[78.6,83.3,80.95]
T_United_Kingdom=[40.0,60.0,50.0]
T_Mali=[77.2,90.3,83.75]
T_Nigeria=[78.8,82.4,80.6]
T_Senegal=[70.0,82.0,76.0]
T_Spain=[46.0,73.0,59.5]
T_United_States_of_America=[33.2,71.9,52.55]
T_Italy=[46.0,78.0,62.0]
T = [T_Guinea, T_Italy, T_Liberia, T_Mali, T_Nigeria, T_Senegal,
     T_Sierra_Leone, T_Spain, T_United_Kingdom, T_United_States_of_America]
print(T[0][0])
O/P:-
73.0
Split the data frame, choose first 0~9947 rows as clean data
ntotal = 9947
ntr = 8000
nts = ntotal - ntr
df_tot = df.loc[0:ntotal,:]
Preprocessing
x_df = df_tot.loc[df['Indicator'] == 'Cumulative number of confirmed, probable and suspected Ebola cases', ['Country', 'Date', 'value']]
x_df_country = x_df.take([0], axis=1)
x_df_date = x_df.take([1], axis=1)

x_country = x_df_country.values
x_date = x_df_date.values
x_date = x_date.ravel()
x_days = pd.to_datetime(x_date, format= "%Y-%m-%d").dayofyear.values
x_country = x_country.ravel()
Now extract the confirmed Ebola cases:-
ls = []
for i in range(x_date.shape[0]):
    ls.append(df_tot.loc[(df['Date'] == x_date[i]) &
                        (df['Country'] == x_country[i]) &
                        (df['Indicator'] == 'Cumulative number of confirmed Ebola cases'),
                        ['value']].take([0], axis=1).values)
Convert cd list to NumPy array of float elements:-
cd_arr = np.array(ls)
for i in range(len(cd_arr)):
    if cd_arr[i].ravel().size == 0:
        cd_arr[i] = float(0.0)
    try:
        cd_arr[i] = cd_arr[i].ravel()[0]
    except:
        continue
Get the total Ebola cases:-
totd_arr = x_df.take([2], axis=1).values
totd_arr = totd_arr.ravel()
Compute the percentage of confirmed ebola ratio but first, fix invalid fields
invalid_fields = np.where(totd_arr == 0)[0]
totd_arr[invalid_fields] = (1, 1)
cd_arr[invalid_fields] = (0, 0)
cd_ratio = cd_arr / totd_arr

y = cd_ratio
Create three arrays ready to be replaced by the lowest temperature,
highest temperature and average temperature.
x_lo_T=np.array([i for i in x_country])
x_hi_T=np.array([i for i in x_country])
x_avg_T=np.array([i for i in x_country])

nCountry = len(np.unique(x_country))
for c in range (nCountry):
    np.place(x_lo_T, x_lo_T == np.unique(x_country)[c], T[c][0])
for c in range (nCountry):
    np.place(x_hi_T, x_hi_T == np.unique(x_country)[c], T[c][1])
for c in range (nCountry):
    np.place(x_avg_T, x_avg_T == np.unique(x_country)[c], T[c][2])
X=np.row_stack([xtr_lo_T, xtr_hi_T, xtr_avg_T, x_days]).T
X=X.astype(float)
# Normalization
X=X/np.max(X,axis=1)[:,None]
X.shape
Linear Model
Linear models describe a continuous response variable as a function of one or more predictor variables. They can help you understand and predict the behavior of difficult systems or analyze experimental, financial, and natural data.
We import the linear model and use the first 80% of data for training and the rest for analysis.
from sklearn import linear_model
ntr = int(np.floor(0.8*X.shape[0]))
xtr = X[:ntr,:]
ytr = y[:ntr]
xts = X[ntr:, : ]
yts = y[ntr:]
#linear regression
regr = linear_model.LinearRegression()
#Trainnig model
regr.fit(xtr,ytr)

#Prediction
y_pred = regr.predict(xts)
Therefore, Assume countries and days are correlated,
Xtr = np.column_stack((np.ones(ntr),xtr[:,0],xtr[:,1],xtr[:,2],xtr[:,3]))
Xts = np.column_stack((np.ones(xts.shape[0]),xts[:,0],xts[:,1],xts[:,2],xts[:,3]))
w1 = ytr[None,:,None]/Xtr[None,:,:]
w1 = np.mean(W1,axis=1)
y_pred1 = w1*Xts
import matplotlib
import matplotlib.pyplot as plt
plt.plot(y_pred,yts,'.')
plt.plot([0.25,1.5],[0.25,1.5],'r-',linewidth=1)
Output Graph:-
Conclusion:
Further ,”The countries with higher temperature (room temperature or above) is likely to increase the speed at which the virus dies in the atmosphere.”
Refrences: https://www.who.int
Leave a Reply