Visualization of Superhero Characters using Python
 By Kanduri Jayanth Sri Ram
In this tutorial, you will learn how to visualize the superhero characters.
Visualization of Superhero Characters in Python
Steps involved:
- Loading packages
- Understanding the data
- Data preprocessing
- Data visualization
Loading packages:
import pandas as pd
import numpy as np
import seaborn as sns
import matplotlib.pyplot as plt
%matplotlib inline
import warnings
warnings.filterwarnings("ignore")
Dataset used: dataset.csv
Reading the data:
df = pd.read_csv('PATH OF THE DATASET')
df.head()
| index | Name | Alignment | Intelligence | Strength | Speed | Durability | Power | Combat | Total |
|---|---|---|---|---|---|---|---|---|---|
| 0 | 3-D Man | good | 50 | 31 | 43 | 32 | 25 | 52 | 233 |
| 1 | A-Bomb | good | 38 | 100 | 17 | 80 | 17 | 64 | 316 |
| 2 | Abe Sapien | good | 88 | 14 | 35 | 42 | 35 | 85 | 299 |
| 3 | Abin Sur | good | 50 | 90 | 53 | 64 | 84 | 65 | 406 |
| 4 | Abomination | bad | 63 | 80 | 53 | 90 | 55 | 95 | 436 |
The shape of the data frame is as follows:
df.shape
(611,9)
Clearly, there are 611 rows and 9 columns in the dataset.
Understanding the data:
No. of missing values in each attribute in the dataset is as follows:
columns = list(df)
for column in columns:
  print("No. of missing values in",column,"attribute:",df[column].isnull().sum())
No. of missing values in Name attribute: 0
No. of missing values in Alignment attribute: 3
No. of missing values in Intelligence attribute: 0
No. of missing values in Strength attribute: 0
No. of missing values in Speed attribute: 0
No. of missing values in Durability attribute: 0
No. of missing values in Power attribute: 0
No. of missing values in Combat attribute: 0
No. of missing values in Total attribute: 0
Dropping rows with null values:
df = df.dropna(axis=0)
df.shape
(608,9)
We can find that three rows are dropped.
Data Visualization:
plt.hist(df['Alignment'])
plt.show()
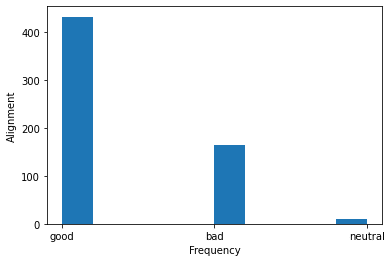
We can observe that there are there classes(Good, bad, and neutral) in the Alignment class. By the above graph, we can also find the frequency of each class.
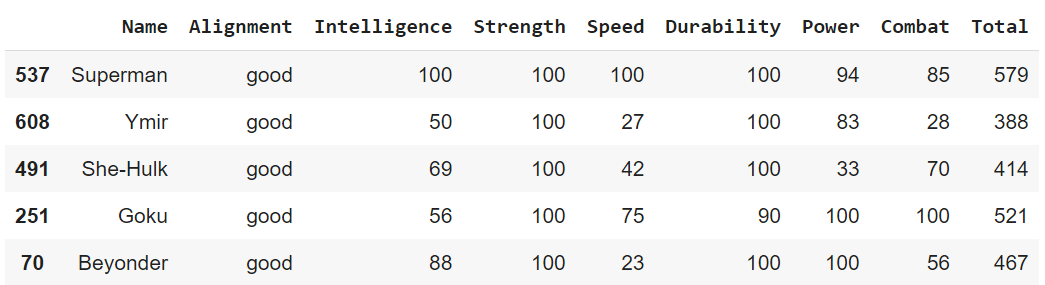
We can find the all good characters and can sort them by strength by the following code:
df1 = df[df['Alignment'] == "good"]
df1.sort_values(by = ['Strength'], ascending = False).head()
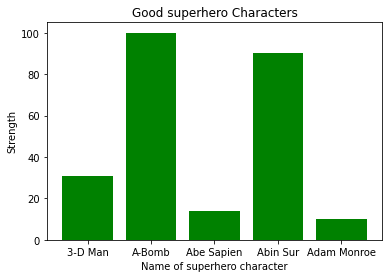
Plotting the graph of five good characters with their strength:
plt.bar(df1["Name"].head(),df1['Strength'].head(), color = "Green")
plt.title("Good superhero Characters")
plt.xlabel("Name of superhero character")
plt.ylabel("Strength")
plt.show()
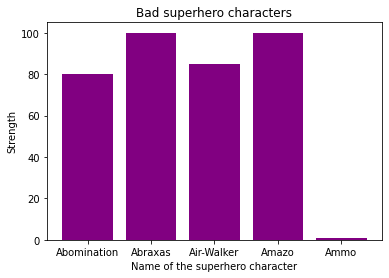
We can find the all bad characters and can sort them by strength by the following code:
df2 = df[df['Alignment'] == "bad"]
df2.sort_values(by = ['Strength'], ascending = False).head()

Plotting the graph of five bad characters with their strength:
plt.bar(df2["Name"].head(),df2['Strength'].head(), color = "Purple")
plt.title("Bad superhero characters")
plt.xlabel("Name of the superhero character")
plt.ylabel("Strength")
plt.show()
Leave a Reply