Visualization of Netflix Data using Python
 By Kanduri Jayanth Sri Ram
In this tutorial, you will learn how to visualize the Netflix data using python.
Visualization of Netflix Data in Python
Steps involved:
- Loading packages
- Understanding the data
- Data preprocessing
- Data visualization
Loading packages:
import pandas as pd
import numpy as np
import matplotlib.pyplot as plt
%matplotlib inline
import seaborn as sns
Dataset used: netflix_dataset.csv
Reading the data:
df = pd.read_csv('PATH OF THE DATASET')
df.head()
df.info()
<class 'pandas.core.frame.DataFrame'>
RangeIndex: 8807 entries, 0 to 8806
Data columns (total 12 columns):
# Column Non-Null Count Dtype
-----------------------------
0 show_id 8807 non-null object
1 type 8807 non-null object
2 title 8807 non-null object
3 director 6173 non-null object
4 cast 7982 non-null object
5 country 7976 non-null object
6 date_added 8797 non-null object
7 release_year 8807 non-null int64
8 rating 8803 non-null object
9 duration 8804 non-null object
10 listed_in 8807 non-null object
11 description 8807 non-null object
dtypes: int64(1), object(11)
memory usage: 825.8+ KB
Data Preprocessing:
Finding the percentage of missing values in each column:
for i in df.columns:
    missing_per = 100 * df[i].isna().sum()/len(df)
    print("{} missing value percentage: {}%".format(i,round(missing_per,4)))
show_id missing value percentage: 0.0%
type missing value percentage: 0.0%
title missing value percentage: 0.0%
director missing value percentage: 29.908%
cast missing value percentage: 9.3675%
country missing value percentage: 9.4357%
date_added missing value percentage: 0.1135%
release_year missing value percentage: 0.0%
rating missing value percentage: 0.0454%
duration missing value percentage: 0.0341%
listed_in missing value percentage: 0.0%
description missing value percentage: 0.0%
Replacing the missing data with a suitable value:
df['director'].replace(np.nan,'No data is available',inplace=True)
df['country'] = df['country'].fillna(df['country'].mode()[0])
df['cast'].replace(np.nan,'No data is available',inplace=True)
df.dropna(inplace=True)
df.drop_duplicates(inplace=True)
Finding the percentage of Movies and TV shows in the overall dataset:
a = df.groupby(['type'])['type'].count()
b = len(df)
val = ((a/b)).round(2)
per = pd.DataFrame(val).T
print(per)
type Movie TV Show
type  0.7    0.3
Dropping irrelevant columns:
df = df.drop(columns =["show_id","director","cast","duration","description"])
df_net_new = df.drop(columns =["date_added","release_year","title","listed_in"])
df_net_new = df_net_new.dropna().reset_index()
df_net_new.head()
Consider only one first country:
for i in range(len(df_net_new["country"])):
    c_string = df_net_new["country"][i]
    split_string = c_string.split(",", 1)
    df_net_new["country"][i] = split_string[0]
df_net_country = df_net_new.groupby(by = ["country","type"])["rating"].count().reset_index()
      country     type     rating
1    Argentina    Movie      51
3    Australia    Movie      52
14   Canada       Movie      162
17   China        Movie      56
25   Egypt        Movie      95
Data Visualization:
Aggregate countries with ratings less than 40 to “other countries” and delete the countries with ratings less than 40.
Movie =0
TV =0
for i in range(len(df_net_country['rating'])):
    if ((df_net_country['rating'][i] < 40) & (df_net_country['type'][i] == "Movie")):
        Movie = Movie + df_net_country['rating'][i]
    if ((df_net_country['rating'][i] < 40) & (df_net_country['type'][i] == "TV Show")):
        TV = TV + df_net_country['rating'][i]
#add a new row to the dataframe
new_row = {'country':'Other Countries', 'type':'Movie', 'rating':Movie}
df_net_country = df_net_country.append(new_row, ignore_index=True)
new_row = {'country':'Other Countries', 'type':'TV Show', 'rating':TV}
df_net_country = df_net_country.append(new_row, ignore_index=True)
df_net_country = df_net_country[df_net_country.rating >= 40]
df_net_country.head(5)
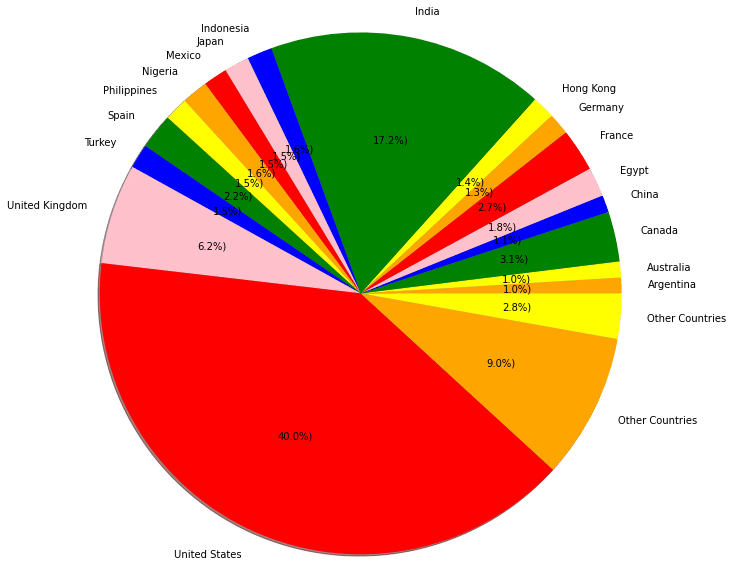
The percentage of ratings of all countries:
import matplotlib.pyplot as plt
colors = ( "orange", "yellow", "green",
          "blue", "pink", "red")

def func(pct, allvalues):
    absolute = int(pct / 100.*np.sum(allvalues))
    return "{:.1f}%)".format(pct, absolute)
plt.pie(df_net_country["rating"], autopct = lambda pct: func(pct, df_net_country["rating"]), labels = df_net_country["country"],radius=3,textprops = dict(color ="black"), colors = colors,shadow = True)
plt.show()
Leave a Reply