Understanding the Bias-Variance Tradeoff in Machine Learning
 By Premkumar Vemula
In this article, we will explore one of the most important topics in machine learning. One can even say this topic is the foundation topic of machine learning. Bias and Variance help us to increase the predictability of our model or rather help us choose a model with better predictability.
Bias
It describes the difference between the true function that our dataset represents and the estimates of our model. A model that is biased means it’s very prejudiced and primitive in terms of its model complexity. It may be trying to predict a highly complex function with just a linear model.
Variance
It represents how much our model changes with a slight change in training data. A highly flexible model is said to have high variance. A flexible model tries to pass through all the training data and hence a small change in training data change the model.
Simply Bias Variance trade-off is represented as :
MSE= (Bias)^2 + Variance(of model) + Variance(of error)
Bias and variance with visualization
Bias is about how much our model is neglecting the pattern in our data and variance is about how accurately it is considering each data point. This definition itself says it all if we try to decrease bias variance increases and if we try to reduce variance bias increases. But from the above equation, it is clear that we want to reduce both the quantities. This sort of confusion leads to a Bias-Variance trade-off.
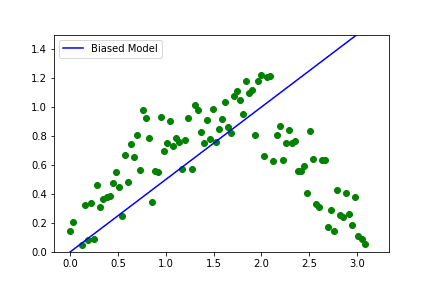
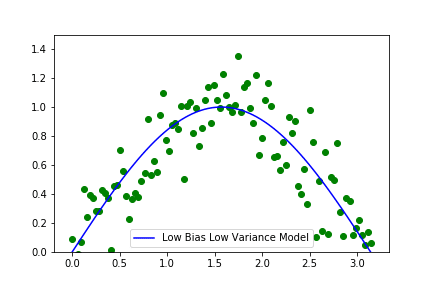
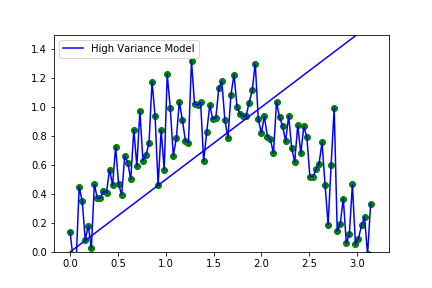
Above is the visual representation of how a model with high bias, high variance and the trade-off between the two would like.
The leftmost image shows a model which is independent of the pattern in the data set it is just a linear regression fit onto the data. The rightmost model is the most flexible one where the model passes through all the points in the dataset. The middle image is the perfect trade-off between the other two models.
But how do we read at trade-off? The answer to this is best described in the below image.

With an increase in bias, there is a decrease in variance and vice versa. But there is a point in between where we have minimum MSE as shown in the figure. This happens because the relation of bias and variance cannot be changed and is shown by the above equation. But the rate at which these quantities change is not the same then we can find a point where their sum(MSE) is the least. In practice, we cannot draw these curves because we never know what the actual curve looks like. So this is achieved by a cross-validation set. We train the model and see how it is working on a cross-validation set which is a previously unknown set. And fix our model to the weights where cross-validation error is the least.
That’s it guys, hope you got some insight into the bias-variance tradeoff. Happy reading!
Leave a Reply