Predicting Stock price using LSTM in Python
 By Infant Raju
Hello everyone, In this tutorial, we are going to see how to predict the stock price in Python using LSTM with scikit-learn of a particular company, I think it sounds more interesting right!, So now what is stock price all about?
A stock price is the price of a share of a company that is being sold in the market. In this tutorial, we are going to do a prediction of the closing price of a particular company’s stock price using the LSTM neural network.
What is LSTM (Long Short Term Memory)?
LSTM is a special type of neural network which has a memory cell, this memory cell is being updated by 3 gates.
- Input gate: It just adds the information to the neural network
- Forget gate: It forgets the unnecessary data feed into the network
- Output gate: It going to get the desired answer out of the neural network.
The data is passed into the neural network and it is updated for every input data. The update function associated with the neural network which is given in the diagram below,

The previous cell state is passed into a function f(W) which updates the neural network cell and gives the present state of the cell.
This f(W) is a function given by Keras (Google’s deep learning product) which is discussed below in the coding session.
So, Now let us move to the coding part.
Loading the dataset for stock price prediction in Machine Learning
Now we need a dataset (i.e. Historical data of the stock price) to feed into our code, the dataset is obtained by the following steps,
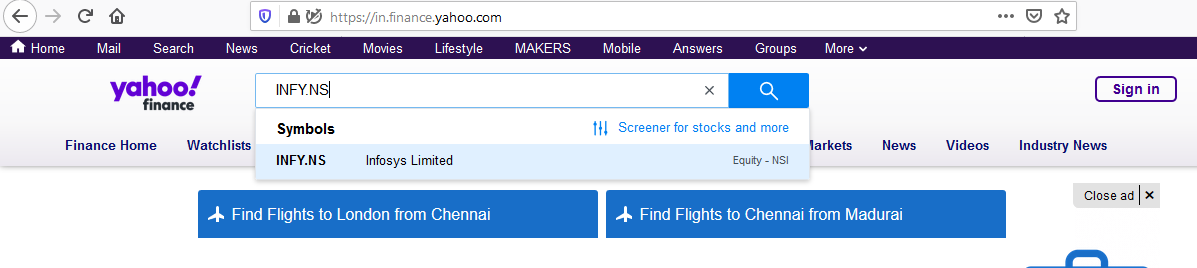
- Open the link “Yahoo Finance“, this will lead you to the Yahoo Finance web page.
- Search for the company for which the stock price is to be predicted in the search bar. Refer to the image below, which searches for the company (INFY).
- Then find the historical data button on the webpage it will lead you to the company’s stock price data, then download the dataset by the download button which is available on the web page.
- For example, the link Infosys historical data will lead to the Infosys stock price data page which is downloadable.

Start Coding: Stock Prediction with sklearn
The entire Coding part is done in Google Colab, Copy the code segments to your workspace in Google Colab.
Refer to this tutorial Google Colab for Machine Learning to get started with the Google Colab, If you are new to Google Colab.
- Input 1: First we are going to Import the packages and load the data set and print the first few values in the dataset.
#importing the packages
import pandas as pd
import numpy as np
import matplotlib.pyplot as plt
from matplotlib.pylab import rcParams
from sklearn.preprocessing import MinMaxScaler

#used for setting the output figure size
rcParams['figure.figsize'] = 20,10

#to normalize the given input data
scaler = MinMaxScaler(feature_range=(0, 1))

#to read input data set (place the file name inside  ' ') as shown below
todataframe = pd.read_csv('INFY.csv')

#to print the first few data in the data set
todataframe.head()
Output:

- Input 2: We are using the ‘Date’ as an index to all the data present and using matplotlib we are going to visualize the data is in a graph.
todataframe['Date'] = pd.to_datetime(todataframe.Date,format='%Y-%m-%d')
todataframe.index = todataframe['Date']
plt.figure(figsize=(16,8))
plt.plot(todataframe['Close'], label='Closing Price')
Output:

- Input 3: LSTM model development.
#importing the packages
from sklearn.preprocessing import MinMaxScaler
from keras.models import Sequential
from keras.layers import Dense, Dropout, LSTM
#dataframe creation
seriesdata = todataframe.sort_index(ascending=True, axis=0)
new_seriesdata = pd.DataFrame(index=range(0,len(todataframe)),columns=['Date','Close'])
length_of_data=len(seriesdata)
for i in range(0,length_of_data):
    new_seriesdata['Date'][i] = seriesdata['Date'][i]
    new_seriesdata['Close'][i] = seriesdata['Close'][i]
#setting the index again
new_seriesdata.index = new_seriesdata.Date
new_seriesdata.drop('Date', axis=1, inplace=True)
#creating train and test sets this comprises the entire data’s present in the dataset
myseriesdataset = new_seriesdata.values
totrain = myseriesdataset[0:255,:]
tovalid = myseriesdataset[255:,:]
#converting dataset into x_train and y_train
scalerdata = MinMaxScaler(feature_range=(0, 1))
scale_data = scalerdata.fit_transform(myseriesdataset)
x_totrain, y_totrain = [], []
length_of_totrain=len(totrain)
for i in range(60,length_of_totrain):
    x_totrain.append(scale_data[i-60:i,0])
    y_totrain.append(scale_data[i,0])
x_totrain, y_totrain = np.array(x_totrain), np.array(y_totrain)
x_totrain = np.reshape(x_totrain, (x_totrain.shape[0],x_totrain.shape[1],1))
#LSTM neural network
lstm_model = Sequential()
lstm_model.add(LSTM(units=50, return_sequences=True, input_shape=(x_totrain.shape[1],1)))
lstm_model.add(LSTM(units=50))
lstm_model.add(Dense(1))
lstm_model.compile(loss='mean_squared_error', optimizer='adadelta')
lstm_model.fit(x_totrain, y_totrain, epochs=3, batch_size=1, verbose=2)
#predicting next data stock price
myinputs = new_seriesdata[len(new_seriesdata) - (len(tovalid)+1) - 60:].values
myinputs = myinputs.reshape(-1,1)
myinputs  = scalerdata.transform(myinputs)
tostore_test_result = []
for i in range(60,myinputs.shape[0]):
    tostore_test_result.append(myinputs[i-60:i,0])
tostore_test_result = np.array(tostore_test_result)
tostore_test_result = np.reshape(tostore_test_result,(tostore_test_result.shape[0],tostore_test_result.shape[1],1))
myclosing_priceresult = lstm_model.predict(tostore_test_result)
myclosing_priceresult = scalerdata.inverse_transform(myclosing_priceresult)
     Output:
        Epoch 1/3
          - 17s - loss: 0.0326
        Epoch 2/3
          - 13s - loss: 0.0158
        Epoch 3/3
          - 13s - loss: 0.0121
LSTM setup
Initially, we are passing the whole data set as a training dataset. (The total data present in INFY.csv which you download in Yahoo finance website is 255).
             totrain = myseriesdataset[0:255,:]
             tovalid = myseriesdataset[255:,:]
Then the LSTM neural network model is created and training data is passed into it.
Note: We are using this statement len(tovalid)+1 to predict the next day’s closing price of the stock
           #predicting next data stock price
           myinputs = new_seriesdata[len(new_seriesdata) - (len(tovalid)+1) - 60:].values
Epoch
Epoch is the number of times the dataset is going to be trained in the network, I have set it to 3. So in the output, we have the details of 3 epochs. We can see as the number of epochs increases loss decreases.
More importantly the f(W) which I have said before in this tutorial is the optimizer=‘adadelta’ which we have set in the LSTM network. This function f(W) given by Keras and we have similar functions like adameta and adagrad etc.. you can try it while you code.
- Input 4: Printing the next day’s predicted stock price.
print(len(tostore_test_result));
print(myclosing_priceresult);
Output:
1
[[9.852873]]
Comparing our predicted output to the original closing price in the image below, where the original closing price of (Nov26th 2019) is (+/-) 0.2 to that of the predicted price. That is we can expect a 0.2 increase or decrease in the predicted output.

Note:
- This predition is not based on Company’s Divident values.
- This predictor work good when the company share values is in a steady mode (ie. when company does’t faces any big gain or loss in their share values).
I hope this tutorial was helpful!!!
Ya, it was very useful for us….thank you
We found this article really help…thank you…
how come the header says “LSTM with scikit-learn” and then the only class from scikit you are using, is MinMaxScaler?