IPL Winner Prediction using Machine Learning in Python
 By Abinash Reddy
In this tutorial, we are going to build a prediction model that predicts the winning team in IPL using Python programming language.
The dataset can be download from here.
The dataset contains data of IPL matches from 2008 to 2019. Which we are going to predict 2020.
Prediction model
Step 1: Import all necessary libraries and dependencies
import numpy as np # linear algebra
import pandas as pd # data processing, CSV file I/O (e.g. pd.read_csv)
import os
from sklearn.model_selection import train_test_split
from sklearn.ensemble import RandomForestClassifier
from sklearn.datasets import make_classification
import matplotlib.pyplot as plt
from sklearn.model_selection import GridSearchCV
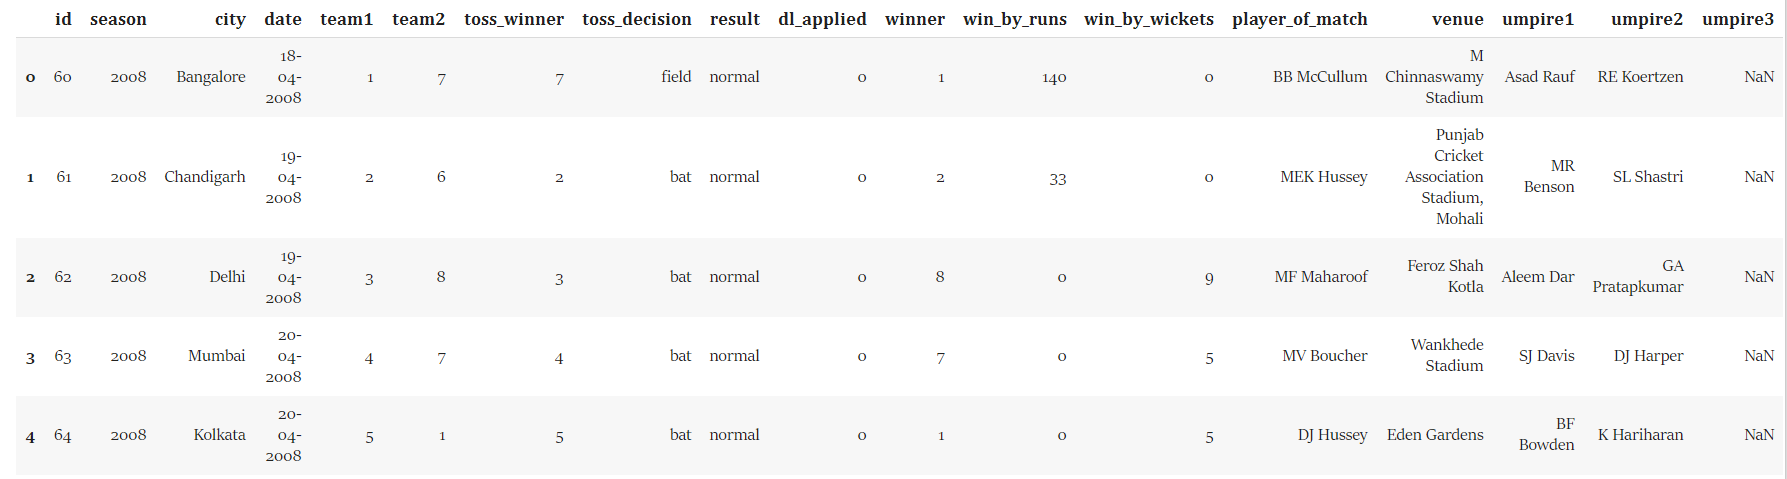
Step 2: Reading CSV files
train_data = pd.read_csv('Training Matches IPL 2008-2019.csv')
train_data.head()
Output

Step 3: Check if any null values present in the dataset. The presence of a null value affects the model and decreases the accuracy rate.
train_data.isnull().sum()
Output

The dataset contains the null value. It is better is to remove the null rows or fill them with some other values. I am going to fill the null values of the city with Abu Dhabi and the null values of the winner with Draw.
train_data['city'].fillna('Abu Dhabi',inplace=True)
train_data['winner'].fillna('Draw', inplace = True)
#Both Rising Pue Supergiant and Rising Pune Supergiants represents same team similarly Delhi Capitals and Delhi Daredevils,
#Deccan Chargers and Sunrisers Hyderabad
train_data.replace("Rising Pune Supergiant","Rising Pune Supergiants", inplace=True)
train_data.replace('Deccan Chargers', 'Sunrisers Hyderabad', inplace=True)
train_data.replace('Delhi Daredevils', 'Delhi Capitals', inplace=True)
Step 4: Data Visulization
Total number of matches played in each season
plt.subplots(figsize = (15,5))
sns.countplot(x = 'season' , data = train_data, palette='dark')
plt.title('Total number of matches played in each season')
plt.show()
Output

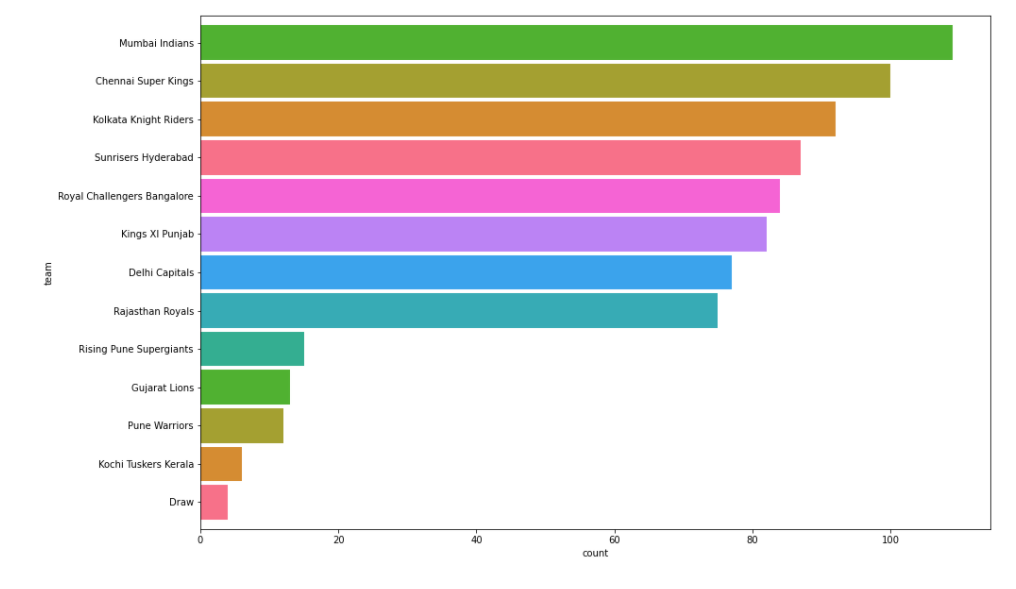
Total number of matches won by each team
Oplt.subplots(figsize=(15,10))
ax = train_data['winner'].value_counts().sort_values(ascending=True).plot.barh(width=.9,color=sns.color_palette("husl", 9))
ax.set_xlabel('count')
ax.set_ylabel('team')
plt.show()
Output
Step 5: Another thing to note is team names are in their short forms in test data and are used in full form in training data. Also, there have been changes in the names of the teams and different teams have participated in different years which we need to remove.
train_data.replace({"Mumbai Indians":"MI", "Delhi Capitals":"DC",
               "Sunrisers Hyderabad":"SRH", "Rajasthan Royals":"RR",
               "Kolkata Knight Riders":"KKR", "Kings XI Punjab":"KXIP",
               "Chennai Super Kings":"CSK", "Royal Challengers Bangalore":"RCB",
              "Kochi Tuskers Kerala":"KTK", "Rising Pune Supergiants":"RPS",
              "Gujarat Lions":"GL", "Pune Warriors":"PW"}, inplace=True)


encode = {'team1': {'KKR':1,'CSK':2,'RR':3,'MI':4,'SRH':5,'KXIP':6,'RCB':7,'DC':8,'KTK':9,'RPS':10,'GL':11,'PW':12},
         'team2': {'KKR':1,'CSK':2,'RR':3,'MI':4,'SRH':5,'KXIP':6,'RCB':7,'DC':8,'KTK':9,'RPS':10,'GL':11,'PW':12},
         'toss_winner': {'KKR':1,'CSK':2,'RR':3,'MI':4,'SRH':5,'KXIP':6,'RCB':7,'DC':8,'KTK':9,'RPS':10,'GL':11,'PW':12},
          'winner': {'KKR':1,'CSK':2,'RR':3,'MI':4,'SRH':5,'KXIP':6,'RCB':7,'DC':8,'KTK':9,'RPS':10,'GL':11,'PW':12,'Draw':13}}
train_data.replace(encode, inplace=True)
train_data.head(5)
Output
dicVal = encode['winner']
train = train_data[['team1','team2','city','toss_decision','toss_winner','venue','winner']]
train.head(5)
Output

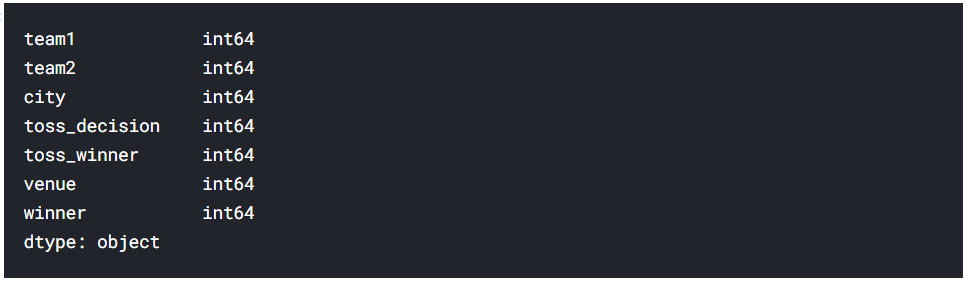
Step 5: Change text to numerical using LabelEncoder
df = pd.DataFrame(train)
var_mod = ['city','toss_decision','venue']
le = LabelEncoder()
for i in var_mod:
    df[i] = le.fit_transform(df[i])
df.types
Output
Step 6: Traning Model
X = df[['team1', 'team2', 'venue']]
y = df[['winner']]
sc = StandardScaler()
X = sc.fit_transform(X)
Before choosing the algorithm first let’s check which algorithm gives the most accurate rate.
logistic_model = LogisticRegression()
logistic_model.fit(X,y)
print("Logistic Regression accuracy: ",(logistic_model.score(X,y))*100)
Random_model = RandomForestClassifier()
Random_model.fit(X,y)
print("Random Forest accuracy: ", (Random_model.score(X,y))*100)
xgb_model = XGBClassifier(n_estimators=390, learning_rate=0.1)
xgb_model.fit(X,y)
print("XGB accuracy: ", (xgb_model.score(X,y))*100)
knn_model = KNeighborsClassifier()
knn_model.fit(X,y)
print("KNeighbor Classifier accuracy", (knn_model.score(X,y))*100)
NB_model = GaussianNB()
NB_model.fit(X,y)
print("Gaussion Navie Bayis accuracy: " ,(NB_model.score(X,y))*100)
decision_model = DecisionTreeClassifier()
decision_model.fit(X,y)
print("Decision Tree Classifier accuracy: ", (decision_model.score(X,y))*100)
svm_model=SVC()
svm_model.fit(X,y)
print("SVM accuracy: ", (svm_model.score(X,y))*100)
Output
Logistic Regression accuracy:  25.264550264550266
Random Forest accuracy:  81.48148148148148
XGB accuracy:  81.34920634920636
KNeighbor Classifier accuracy 61.50793650793651
Gaussion Navie Bayis accuracy:  34.78835978835979
Decision Tree Classifier accuracy:  81.48148148148148
SVM accuracy:  50.132275132275126
Both the Decision Tree Classifier and Random Forest gives the most accuracy. So we can choose anyone for creating a predicting model.
Step 6: Testing model on the test dataset.
test_data = pd.read_csv('Testset Matches IPL 2020.csv')
encode = {'team1': {'KKR':1,'CSK':2,'RR':3,'MI':4,'SRH':5,'KXIP':6,'RCB':7,'DC':8,'KTK':9,'RPS':10,'GL':11,'PW':12},
         'team2': {'KKR':1,'CSK':2,'RR':3,'MI':4,'SRH':5,'KXIP':6,'RCB':7,'DC':8,'KTK':9,'RPS':10,'GL':11,'PW':12}}
test_data.replace(encode,inplace=True)
var_mod = ['venue']
le = LabelEncoder()
for i in var_mod:
    test_data[i] = le.fit_transform(test_data[i])
Using Random Forest Model
test_X = test_data[['team1','team2','venue']]
test_X = sc.fit_transform(test_X)
y_predict = Random_model.predict(test_X)
newlist = list()
for i in y_predict:
    newlist.append(list(dicVal.keys())[list(dicVal.values()).index(i)])
test_data['winner'] = newlist
test_data['venue'] = le.inverse_transform(test_data['venue'])
for i in range(60):
    test_data['team1'][i]=(list(dicVal.keys())[list(dicVal.values()).index(test_data['team1'][i])])
    test_data['team2'][i]=(list(dicVal.keys())[list(dicVal.values()).index(test_data['team2'][i])])
test_data.loc[test_data["winner"]==test_data["team1"],"winner_team"]=1
test_data.loc[test_data["winner"]!=test_data["team1"],"winner_team"]=2
test_data['win_by_number']=test_data['winner_team'].astype(int)
test_data.head()
Output

bro in second column winner prediction is wrong
hi did you manage to find the correction in the code?
In the second row winner RCB is not present in team1 and team2