Implement a Superellipse in Python
 By Karun Thannickal
In, this tutorial we learn how to implement a Superellipse in Python. We do this with the help of the NumPy and Matplotlib libraries.
We use NumPy to conveniently access mathematical functions. Similarly, we make use of Matplotlib to plot the required graphs.
Superellipse
The set of all points (x, y) on the curve, given by the equation below:
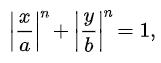
forms a 2-dimensional figure known as a Superellipse.
Superellipses for various values of ‘n’ are shown below.
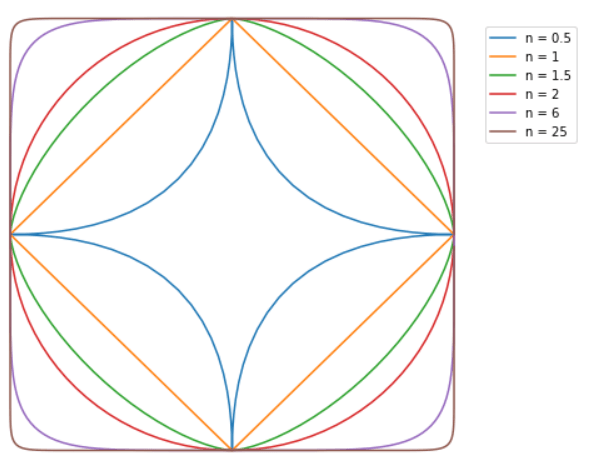
A superellipse is a closed curve similar to an ellipse. Like an ellipse, it has a semi-major axis as well as a semi-minor axis. It exhibits symmetry about these axes. However, a superellipse has a different shape from an ellipse.
The parametric equation of a superellipse is given by the equation
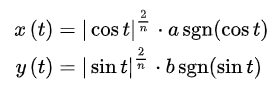
We use this parametric form to plot the Superellipse in Python.
Code for Plotting a Superellipse
We can easily plot a Superellipse in Python with the help of NumPy and Matplotlib. We follow the steps given below.
First, we import the necessary modules and libraries.
import matplotlib.pyplot as plt
import numpy as np
Secondly, we set the values for ‘a’, ‘b’ and ‘n’ as required.
# we set appropriate values for 'a', 'b' and 'n'
a = 5
b = 4
n = 1.37
Next, we create a list of values for the parameter, ‘t’. With the help of NumPy, we find corresponding values for ‘x’ and ‘y’.
# values for 't', 'x' and 'y' with the help of NumPy
t = np.linspace(0, 2 * np.pi, 100)
x = ((np.abs(np.cos(t))) ** (2 / n)) * a * np.sign(np.cos(t))
y = ((np.abs(np.sin(t))) ** (2 / n)) * b * np.sign(np.sin(t))
Finally, we plot the curve with the help of the Pyplot module of Matplotlib
# plotting the curve
plt.axis('equal')
plt.plot(x, y)

plt.show()
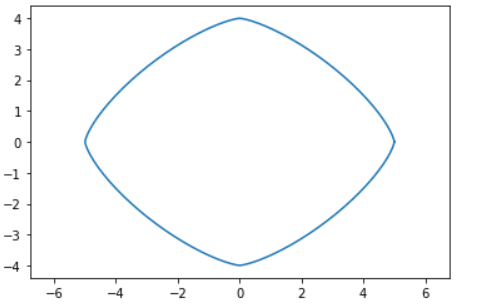
Output
Now after we run the code, we will able to see the plot of our Superellipse just like you can see below:
Conclusion
In this tutorial, we learned about superellipses. We looked at various equations describing a superellipse. Finally, we implemented a superellipse draw in Python using the matplotlib.
Leave a Reply