How to plot an angle in Python using matplotlib
 By Tushit Garg
This article is based on some interesting graph plotting problems and their solutions. Let us consider one of those problems which you might probably encounter while practicing graph plotting. Learn how to plot an angle in Python using matplotlib.
As the name of the article suggests, we need to plot an angle between two straight lines using the matplotlib plotting library of python. For an intuition that we are going to plot, see the image below.

Steps for plotting the angle in matplotlib – Python
- Draw two random straight lines intersecting each other.
- Find the intersection point between the two straight lines.
- Plot a circle with the intersection point as the center of the circle.
- Find the intersection points between the straight lines and the circle.
- Calculate the angle of each intersection point.
- Plot the angle.
First step: Draw two random straight lines in matplotlib
First of all, draw two straight lines intersecting each other. The code is given below.
import matplotlib.pyplot as plt
import numpy as np

m1, b1 = (1/3), 2.0 # slope and intercept for line 1
m2, b2 = (3/2), 0.0 # slope and intercept for line 2

x = np.linspace(-5,5,100)

plt.figure(figsize=(8,8))

plt.xlim(0,5)
plt.ylim(0,5)

plt.title('Two random straight lines')

plt.plot(x,x*m1+b1)  # plotting line 1
plt.plot(x,x*m2+b2)  # plotting line 2
Output:

Second step: Finding the intersection point between the two straight lines in Matplotlib
Let the point of intersection be denoted be (x0,y0). Let the two equations of the straight lines be:
y1 = m1*x + b1
y2 = m2*x + b2
On solving the above equations simultaneously we get:
x0 = (b2 – b1) / (m1 – m2)
y0 = m1*x0 + b1
Let us plot this intersection point in the above plot by adding the following code:
x0 = (b2-b1)/(m1-m2)
y0 = m1*x0 + b1
plt.scatter(x0,y0, color='black')
Output:

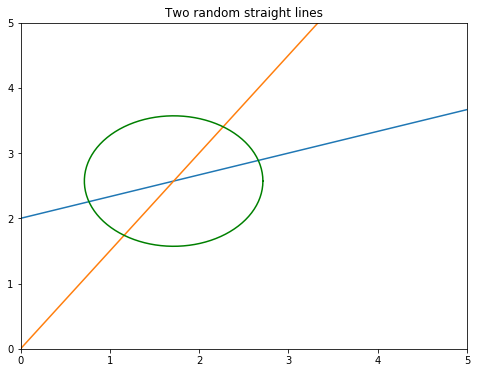
Third step: Plot a circle with the intersection point as the center of the circle in Matplotlib
To plot a circle we need x and y points for each angle that the radius makes with the x-axis.
x = r cos θ
y = r sin θ , where r is the radius of the circle and 0 <= θ <= 2π
Reference link-> https://www.mathopenref.com/coordparamcircle.html
Code for plotting the circle:
theta = np.linspace(0,2*np.pi,100)  # 0 <= θ <= 2π

r =  1.0 #circle radius

x1 = r * np.cos(theta) + x0
x2 = r * np.sin(theta) + y0

plt.plot(x1, x2, color='green')
Output:
Fourth step: Find the intersection points between the straight lines and the circle in Matplotlib
Now, let us find the intersection points between the lines and the circle and plot them.
Below is the code. Read the comments to understand the code.
x_points = []
y_points = []

def intersection_points(slope,intercept,x0,y0,radius):

    a = 1 + slope**2  # 1+m^2
    b = -2.0*x0 + 2*slope*( intercept - y0 )  # 2m(c1-y0) - 2x0
    c = x0**2 + (intercept-y0)**2 - radius**2 # x0^2+(c1-y0)^2-r^2

    # solving the quadratic equation:

    delta = b**2 - 4.0*a*c  # b^2 - 4ac
    x1 = ( -b + np.sqrt(delta) ) / ( 2.0 * a )
    x2 = ( -b - np.sqrt(delta) ) / ( 2.0 * a )

    x_points.append(x1)
    x_points.append(x2)

    y1 = slope*x1 + intercept
    y2 = slope*x2 + intercept

    y_points.append(y1)
    y_points.append(y2)

    return None

# Finding the intersection points for line1 with circle
intersection_points(m1,b1,x0,y0,r)

# Finding the intersection points for line1 with circle
intersection_points(m2,b2,x0,y0,r)

# Plotting the different intersection points.
plt.scatter( x_points[0], y_points[0], color='red' )
plt.scatter( x_points[1], y_points[1], color='red' )
plt.scatter( x_points[2], y_points[2], color='red' )
plt.scatter( x_points[3], y_points[3], color='red' )
# Naming the points.
plt.text( x_points[0], y_points[0], 'p1', color='black' )
plt.text( x_points[1], y_points[1], 'p2', color='black' )
plt.text( x_points[2], y_points[2], 'p3', color='black' )
plt.text( x_points[3], y_points[3], 'p4', color='black' )
Output:

Fifth step: Calculate the angle of each intersection point in Matplotlib – Python
Now we need to calculate the angle for each intersection point.
Find the code below:
def get_angle(x,y,x0,y0,radius):

    base = x - x0
    hypotenuse = radius

    # calculating the angle for a intersection point
    # which is equal to the cosine inverse of (base / hypotenuse)

    theta = np.arccos(base / hypotenuse)

    if y-y0 < 0:
        theta = 2*np.pi - theta

    print('theta=',theta,',theta in degree=',np.rad2deg(theta),'\n')

    return theta

theta_list = []

for i in range(len(x_points)):

    x = x_points[i]
    y = y_points[i]

    print('intersection point p{}'.format(i))
    theta_list.append( get_angle(x,y,x0,y0,r) )
Output:

Last step: Plot the angle in Matplotlib
Lastly, we would plot the angle between two intersection points.
Refer to the code below and follow the comments to understand the code.
# angle for intersection point1 ( here point p1 is taken)
p1 = theta_list[0]

# angle for intersection point2 ( here point p4 is taken)
p2 = theta_list[3]

# all the angles between the two intesection points
theta = np.linspace(p1, p2, 100)

# calculate the x and y points for
# each angle between the two intersection points
x1 = r * np.cos(theta) + x0
x2 = r * np.sin(theta) + y0

# plot the angle
plt.plot(x1, x2, color='green')

# Code to print the angle at the midpoint of the arc.
mid_angle = ( p1 + p2) / 2.0

x_mid_angle = (r-0.5) * np.cos(mid_angle) + x0
y_mid_angle = (r-0.5) * np.sin(mid_angle) + y0

angle_in_degree = round( np.rad2deg(abs(p1-p2)),1)

plt.text(x_mid_angle, y_mid_angle, angle_in_degree, fontsize=12)

# plotting the intersection points
plt.scatter( x_points[0], y_points[0], color='red' )
plt.scatter( x_points[3], y_points[3], color='red' )
plt.text( x_points[0], y_points[0], 'p1', color='black' )
plt.text( x_points[3], y_points[3], 'p4', color='black' )
Output:

I hope you liked the article. Comment if you have any doubts or suggestions regarding this article.
You can also read other articles related to this. Click the links given below.
Leave a Reply