How to hide the floating toolbar in Plotly in Python
 By Seepak Kumar
Plotly provides interactive plots by offering a wide range of editing tools and options to alter the display of the graph. When we hover over a graph, we get to see a floating toolbar showing a bunch of tools. But we are not always sure which tools to use for our plots. Sometimes this toolbar can be quite distracting. And we would just want the plot without the floating toolbar to avoid distraction.
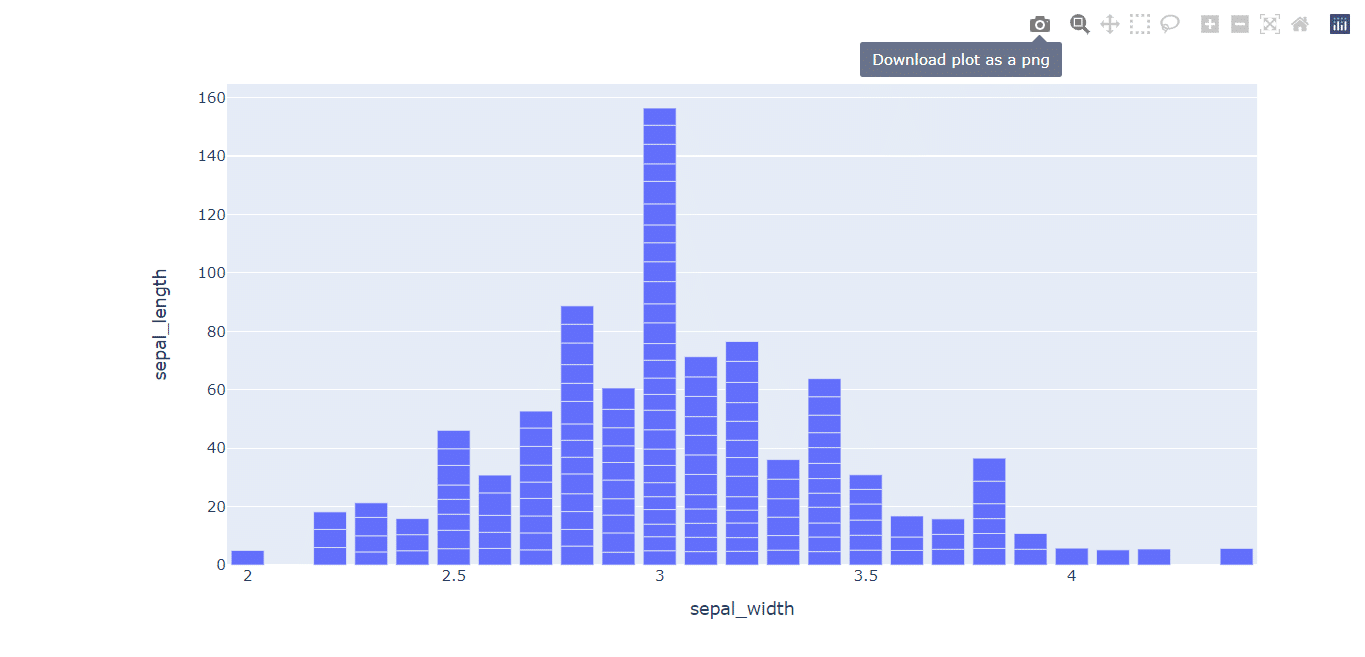
Plot with floating toolbar
import plotly.express as px

# using the iris dataset
df = px.data.iris()

# plotting the bar chart
fig = px.bar(df, x="sepal_width", y="sepal_length")

# showing the plot
fig.show()
Plot without floating toolbar in Python
import plotly.express as px

# using the iris dataset
df = px.data.iris()

# plotting the bar chart
fig = px.bar(df, x="sepal_width", y="sepal_length")

# showing the plot
fig.show(
        config= dict(
            displayModeBar = False)
        )

To disable this floating toolbar, we can pass a single config parameter to the plot function. We use the predefined config object in Plotly. And we just need to set displayModeBar to false in the config object. This parameter passed in dictionary format will hide the floating toolbar once and for all.
Read more: Create Multiple Subplots using Matplotlib Subplot in Python
Worked like a charm. I’ve been struggling for so long. Thank you!