Difference Between cla(), clf() and close() Methods in Matplotlib Python
 By Yeshwanth Karnam
Matplotlib is a module that is used for data visualization and we can use this in machine learning also. It is an extension of NumPy library, In this matplotlib we have pyplot library which we can use to plot graphs, bar graphs, histograms, scatter plots etc. matplotlib provides a MAT-LAB like interface. In this tutorial we will be learning about the methods cla(), clf(), close() which are part of matplotlib.
cla() in Python
cla() is a method in the pyplot that is part of matplotlib library .cla() is used to clear the current axes, it just removes the graph. it is a method related to axes.
Syntax:
matplotlib.pyplot.cla()
Example:
import numpy as np
import matplotlib.pyplot as plt
x = np.arange(0,4*np.pi,0.1)   # start,stop,step
s = np.sin(x)
c= np.cos(x)
fig, [ax, ax1] = plt.subplots(2, 1)
ax.set_ylabel('y-axis')
ax.plot(s)
ax.grid(True)
ax1.set_ylabel('y-axis')
ax1.set_xlabel('x-axis')
ax1.plot(c)
ax1.grid(True)
#calling cla function
ax1.cla()
fig.suptitle('cla Example')
plt.show()
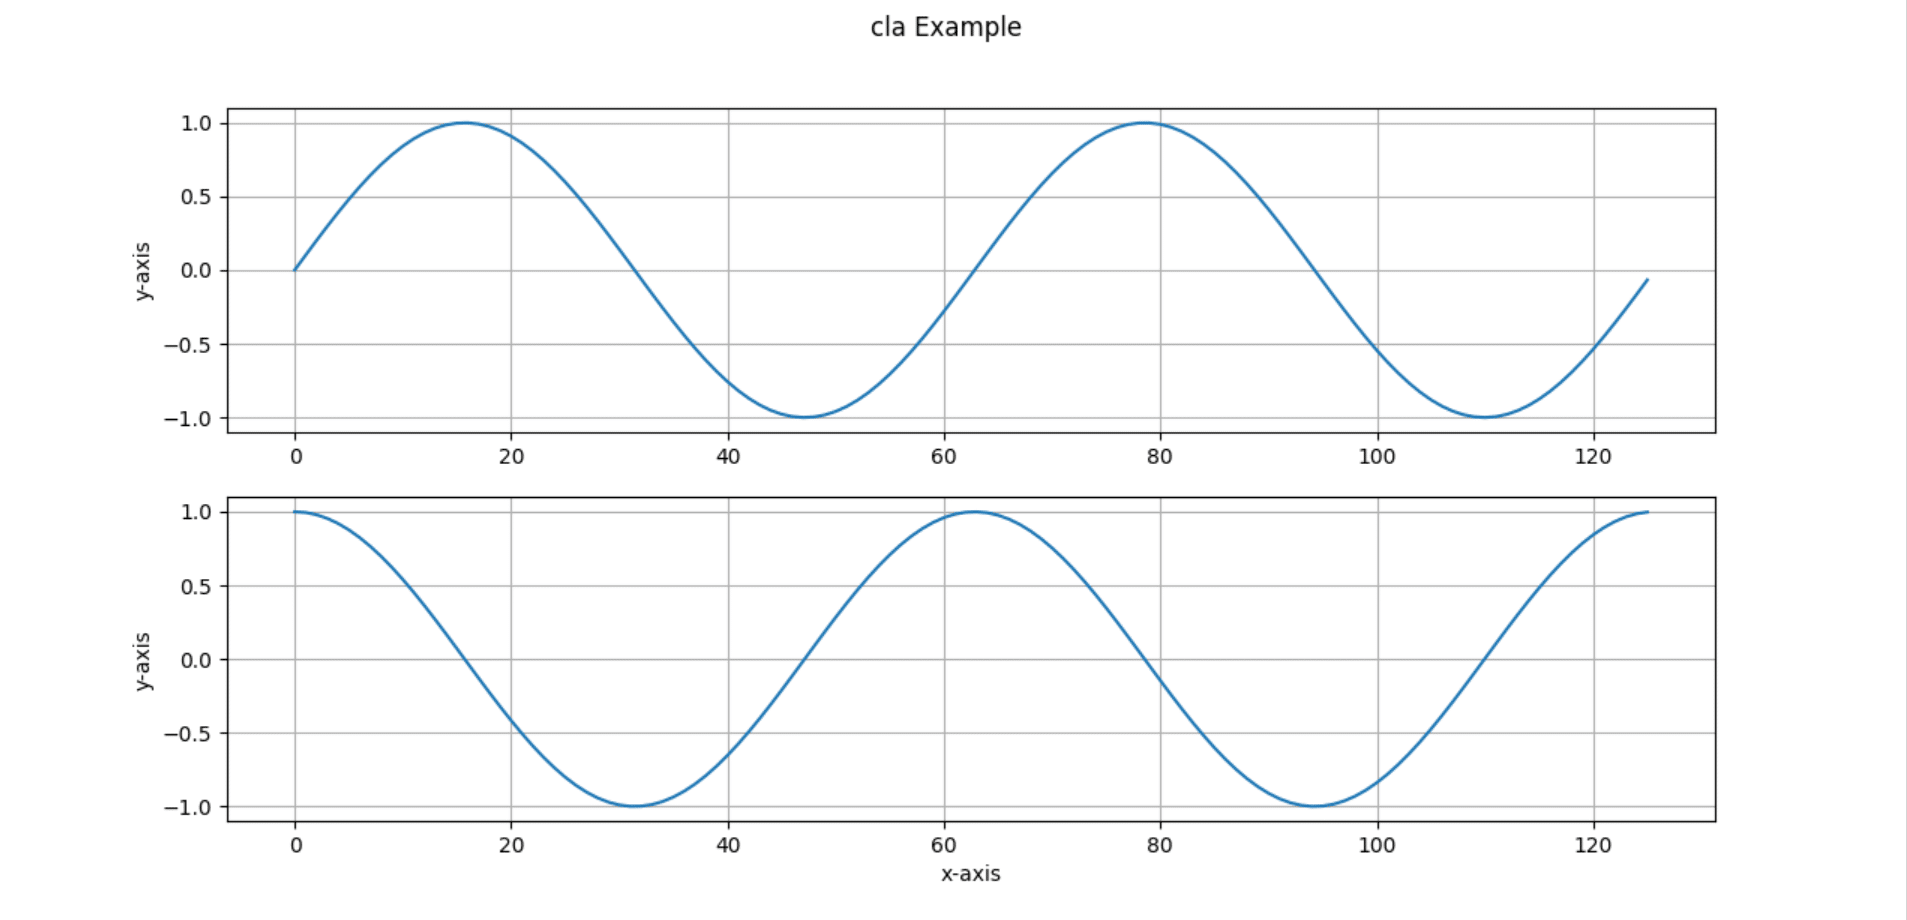
Before executing cla() function :

Output:

here if we compare these both images, we can know the functionality of cla() clearly.
clf() in Matplotlib Python
clf() is a method that is in pyplot module which is in matplotlib library. clf() method is used to clear the entire plot and figure.it also clears subplots. it leaves empty space for re-usage of other plots.
Syntax:
matplotlib.pyplot.clf()
Example
import numpy as np
import matplotlib.pyplot as plt
x = np.arange(0,4*np.pi,0.1)   # start,stop,step
s = np.sin(x)
c= np.cos(x)
fig, [ax, ax1] = plt.subplots(2, 1)
ax.set_ylabel('y-axis')
ax.plot(s)
ax.grid(True)
ax1.set_ylabel('y-axis')
ax1.set_xlabel('x-axis')
ax1.plot(c)
ax1.grid(True)
#calling clf function
plt.clf()
fig.suptitle('clf Example')
plt.show()
before using clf():
After using clf():

if you observe these images we can easily know the purpose of the clf().
close()
close() is a method that is used to close the output window completely. there will be no output for this method
Syntax:
matplotlib.pyplot.close()
Example:
import numpy as np
import matplotlib.pyplot as plt
x = np.arange(0,4*np.pi,0.1)   # start,stop,step
s = np.sin(x)
c= np.cos(x)
fig, [ax, ax1] = plt.subplots(2, 1)
ax.set_ylabel('y-axis')
ax.plot(s)
ax.grid(True)
ax1.set_ylabel('y-axis')
ax1.set_xlabel('x-axis')
ax1.plot(c)
ax1.grid(True)
#calling close function
plt.close()
plt.show()
Also read: How to rotate the Tick Labels in Matplotlib in Python
Leave a Reply