Diagnose Overfitting and Underfitting of LSTM Models in Python
 By Ujjwal Tyagi
Hello there my fellow machine learning enthusiasts. Well, today we are going to learn about how to Diagnose Overfitting and Underfitting of LSTM Models in Python.
Let’s start with a quick brief on what is an LSTM Model…
LSTM Model:
-> LSTM Network or Long Short Term Memory Network is a type of Recurrent Neural Network.
-> It can give outputs keeping in memory the previous ones.
-> Unlike normal neural networks, LSTM has a feedback mechanism.
-> can process the whole sequence of data at one time.
-> E.g.: Consider the example of a sequence that translates a sentence from one language to another.
So, now for the grammatical references, the model needs to have a memory of what words it chooses before.
And that where the feedback mechanism and memory comes into place.
With the help of them, the model can predict a grammatically correct translation.
Now, let us see why we need to diagnosis an LSTM model.
Why Diagnose?
-> We perform Diagnoses in the spirit of finding the best fit for the model.
-> The given model might be suffering from overfitting or underfitting.
-> With the diagnoses we can find out the scenario and then work in the direction to correct it.
-> Ways of correcting can be to tune the parameters and hyperparameters.
Now, let us see how we diagnose an LSTM model…
Diagnosing an LSTM Model:
Well, we see the walkaround for getting the diagnose using the Keras framework.
For diagnoses of underfitting and overfitting, we plot the loss and accuracy of the training and validation data set.
If a model has a low train accuracy and a high train loss, then the model is suffering from underfitting.
If a model has a high train accuracy but a low validation accuracy then the model is suffering from overfitting.
And, hence we plot the respective graphs to compare the loss and accuracy of the models.
Plotting:
For plotting, we are going to use the matplotlib library.
In Keras’ framework, a model is trained by calling fit() function.
This function has an object called history which stores the loss and accuracy (if specified in the metrics) after each epoch.
Now, let us see how the model builds:
model = Sequential()
model.add(LSTM(5, input_shape=(1,1)))
model.add(Dense(1, activation='sigmoid'))
model.compile(loss='binary_crossentropy', optimizer='adam', metrics=['accuracy'])
history = model.fit(X, Y, epochs=50, validation_split=0.2)
Here, we have added an LSTM model of 5 layers.
And, then an output layer with sigmoid activation follows it.
Here we are using running a model with loss function “binary cross-entropy”, an optimization algorithm is “adam” and the metrics parameter specifies that we need the accuracy as well.
In the history object, we have specified 20% of train data for validation because that is necessary for checking the overfitting and underfitting.
Now, we are going to see how we plot these graphs:
For plotting Train vs Validation Loss:
plt.plot(history.history['loss'], 'r', label='Training loss')
plt.plot(history.history['val_loss'], 'g', label='Validation loss')
plt.title('Training VS Validation loss')
plt.xlabel('No. of Epochs')
plt.ylabel('Loss')
plt.legend()
plt.show()
Output:

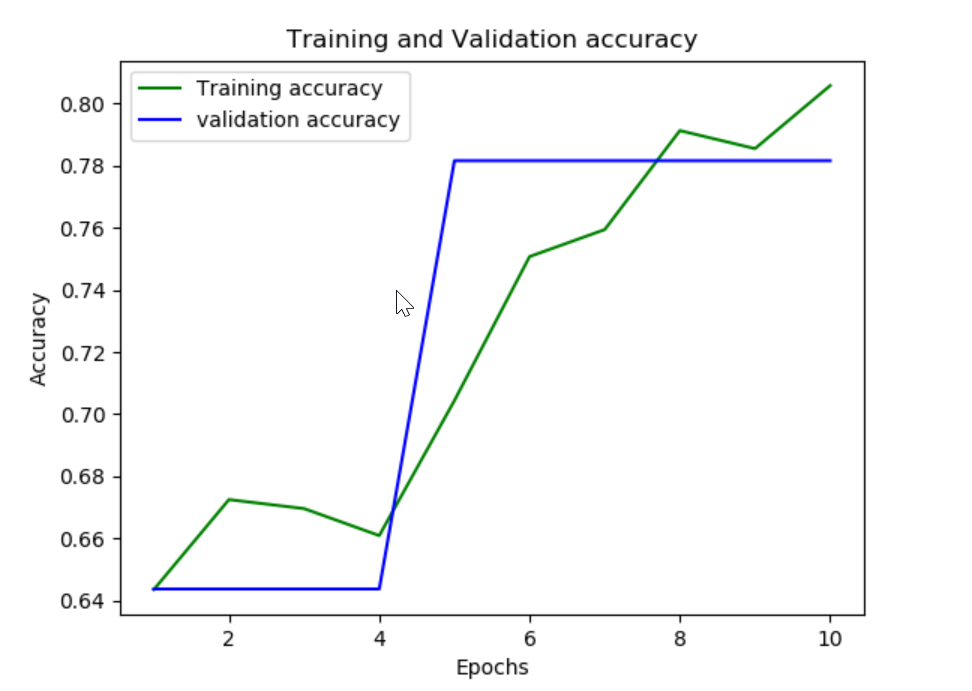
And, for plotting Train Vs Validation accuracy:
plt.plot(history.history['acc'], 'r', label='Training accuracy')
plt.plot(history.history['val_acc'], 'g', label='Validation accuracy')
plt.title('Training Vs Validation Accuracy')
plt.xlabel('No. of Epochs')
plt.ylabel('Accuracy')
plt.legend()
plt.show()
Output:
And, there we have it how to “Diagnose Overfitting and Underfitting of LSTM Models in Python”.
I hope you liked the read.
Thanx for reading.
Leave a Reply