Detection of COVID-19 From Chest X-Ray Images Using Machine Learning
 By Monalisa Panda
In this tutorial, we will learn how to detect COVID-19 from chest X-ray images using machine learning in Python.
Undoubtedly Those who are reading this article are already familiar with the crisis of Coronavirus Whole over the World.
Build a Model that automatically Detect the Patient having Coronavirus or Not
Well! Can you distinguish between two x-ray images and tell which x-ray image is having coronavirus or not. I bet you can’t but a Machine Can.
In this tutorial, we are going to make a model that can predict whether the X-Ray image contains coronavirus or not.
Here is the Approach:
- You have to create a Dataset contains two folders, in which one has sampled X-Ray images of Normal Patients (which you can get from this Kaggle Link). I have taken around 100 sampled X-ray images of Normal patients.
- Then you have to create another folder in which you will put the X-Ray images of coronavirus patients. (For this you have to do some Data Analysis Stuffs.)
- After creating two folders we will merge the images and set the labels
- Then we will split that into training and testing set and create a VGG model that will predict our data.
So Let’s Deep Dive into the code!!
Get the X-ray Images of COVID-19 Patients
First, you need to collect the X-ray images of the patient’s results positive for coronavirus.
This Kaggle Link contains X-ray images of pneumonia, COVID-19, and Normal patients. We need to figure out the X-Rays Images of coronavirus.
Step-1: Read the Dataset metadata.csv
import numpy as np
import pandas as pd
covid_data=pd.read_csv('metadata.csv')
covid_data.head()
Output:
The first 5 rows of the dataset.
Step-2: Drop the columns with NAN Values
covid_data.dropna(axis=1,inplace=True)
Step-3: Analyze the Finding Column
covid_data.groupby('finding').count()
Output:

Step-4: Extract The X-Ray Images that tested Positive for COVID-19
In this Step we will extract the X-rays of COVID-19 patients. for that we will iter over the dataset and count the rows where the finding is equal to COVID-19, and view should be PA(Posterioranterior).
import pandas as pd
import shutil
import os

# Selecting all combination of 'COVID-19' patients with 'PA' X-Ray view
coronavirus = "COVID-19" # Virus to look for
x_ray = "PA" # View of X-Ray

metadata = "metadata.csv" # Metadata.csv Directory
imageDir = "images" # Directory of images
outputDir = 'Data//Covid' # Output directory to store selected images

metadata_csv = pd.read_csv(metadata)

# loop over the rows of the COVID-19 data frame
for (i, row) in metadata_csv.iterrows():
    if row["finding"] != coronavirus or row["view"] != x_ray:
        continue

    filename = row['filename'].split(os.path.sep)[-1]
    filePath = os.path.sep.join([imageDir, filename])
    shutil.copy2(filePath, outputDir)
print('Done')
Output:
Done
After you got all the X-ray images of COVID-19, you must put it in another folder that mentioned before. I have taken around 100 X-ray images of COVID-19 for this model.
Put the folder inside the dataset folder you have created. Therefore, inside the Dataset folder(But in my case it’s Data), Normal and COVID folders are there. However, you could rename the folders. Now ZIP the folder, as a result, to use Google colab.
Build The Model
Step-1: Mount your drive
from google.colab import drive
drive.mount('/content/gdrive')
Output:
Drive already mounted at /content/gdrive; to attempt to forcibly remount, call drive.mount("/content/gdrive", force_remount=True).
Step-2: Unzip your file
!unzip -q "/content/gdrive/My Drive/Data.zip"
Step-3: Import all the necessary Libraries
import matplotlib.pyplot as plt
import argparse
import os
from tensorflow.keras.preprocessing.image import ImageDataGenerator
from tensorflow.keras.applications import VGG16
from tensorflow.keras.layers import AveragePooling2D
from tensorflow.keras.layers import Dropout
from tensorflow.keras.layers import Flatten
from tensorflow.keras.layers import Dense
from tensorflow.keras.layers import Input
from tensorflow.keras.models import Model
from tensorflow.keras.optimizers import Adam
from tensorflow.keras.utils import to_categorical
from sklearn.preprocessing import LabelBinarizer
from sklearn.model_selection import train_test_split
Step-4: Initialize the Epochs and the Batch Size
INIT_LR = 1e-3
EPOCHS = 10
BS = 8
dataset = "/content/Data" #The Dataset
args={}
args["dataset"]=dataset
Step-5: Set Labels into the images
import numpy as np
import cv2
iPaths = list(paths.list_images(args["dataset"]))  #image paths
data = []
labels = []
for iPath in iPaths:
    label = iPath.split(os.path.sep)[-2]   #split the image paths
    image = cv2.imread(iPath)
    image = cv2.cvtColor(image, cv2.COLOR_BGR2RGB) #Convert images into RGB Channel
    image = cv2.resize(image, (224, 224))  #Resizing the images
    data.append(image)
    labels.append(label)
data = np.array(data) / 255.0
labels = np.array(labels)
Firstly we will load the data, on the other hand, we will fetch the images present inside the Data. Then set labels according to the image. as a result, we then scale pixel intensities to the range [0,1] and convert both Data and Labels to NumPy array format.
Meanwhile, Let’s Have a Look of the X-rays
import os
Data_Dir = "Data//"
Cimages = os.listdir(Data_Dir+"Covid")
Nimages = os.listdir(Data_Dir+"Normal")
import matplotlib.pyplot as plt
import cv2
import skimage
from skimage.transform import resize
import numpy as np
def plotter(i):
    normal = cv2.imread(Data_Dir+"Normal//"+Nimages[i])
    normal = skimage.transform.resize(normal, (150, 150, 3))
    coronavirus = cv2.imread(Data_Dir+"Covid//"+Cimages[i])
    coronavirus = skimage.transform.resize(coronavirus, (150, 150, 3) , mode = 'reflect')
    pair = np.concatenate((normal, coronavirus), axis=1)
    print("Normal Chest X-ray Vs Covid-19 Chest X-ray")
    plt.figure(figsize=(10,5))
    plt.imshow(pair)
    plt.show()
for i in range(0,5):
    plotter(i)
Output:
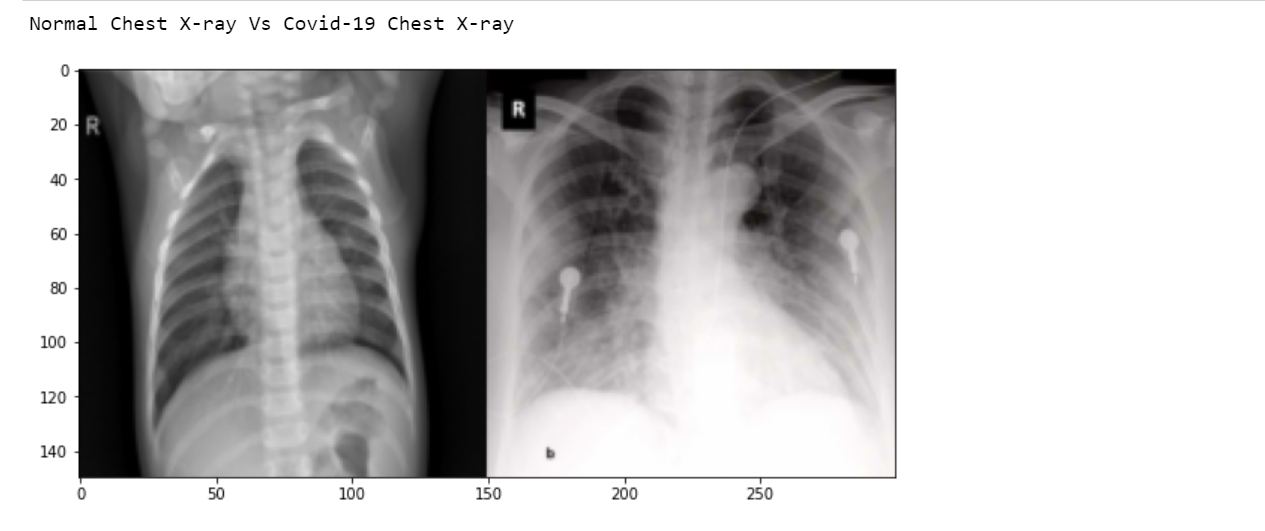
Here the output shows the first row. However, the Output will show up to 5 rows.
Step-6: Perform One Hot Encoding into the Labels
LB = LabelBinarizer()  #Initialize label binarizer
labels = LB.fit_transform(labels)
labels = to_categorical(labels); print(labels)
(X_train, X_test, Y_train, Y_test) = train_test_split(data, labels,test_size=0.20, stratify=labels, random_state=42)
trainAug = ImageDataGenerator(
    rotation_range=15,
    fill_mode="nearest")
Here we perform one-hot encoding. for instance, in addition, the COVID-19 label is 0 Likewise, Normal is 1. On the other hand, we split our data into training and testing sets. where the training set contains 80% of the data in the same vein test set contains 20%.
Step-7: Create The VGG Model
bModel = VGG16(weights="imagenet", include_top=False,input_tensor=Input(shape=(224, 224, 3)))  #base_Model
hModel = bModel.output #head_Model
hModel = AveragePooling2D(pool_size=(4, 4))(hModel)
hModel = Flatten(name="flatten")(hModel)
hModel = Dense(64, activation="relu")(hModel)
hModel = Dropout(0.5)(hModel)
hModel = Dense(2, activation="softmax")(hModel)
model = Model(inputs=bModel.input, outputs=hModel)
for layer in bModel.layers:
    layer.trainable = False
Create a VGG Model. In addition Left the Top layer empty(include_top=False). subsequently, construct a fully connected layer and append it on the top of the VGG model.
Subsequently, let’s check the training and test set. In other words, analyze the shape of training and test data.
X_train.shape,X_test.shape,Y_train.shape,Y_test.shape
Output:
((160, 224, 224, 3), (40, 224, 224, 3), (160, 2), (40, 2))
In short, we left with 160 images for training and 40 images for testing.
Let’s analyze the training data. To clarify what’s in the training data.
W_grid = 4 #width
L_grid = 4 #lenth
fig, axes = plt.subplots(L_grid, W_grid, figsize = (25, 25)) #subplots
axes = axes.ravel()
n_training = len(X_train)
for i in np.arange(0, L_grid * W_grid):
    index = np.random.randint(0, n_training) # pick a random number
    axes[i].imshow(X_train[index])
    axes[i].set_title(Y_train[index])
    axes[i].axis('off')
plt.subplots_adjust(hspace = 0.4) #hspace indicates the space between the height of the images
Output:
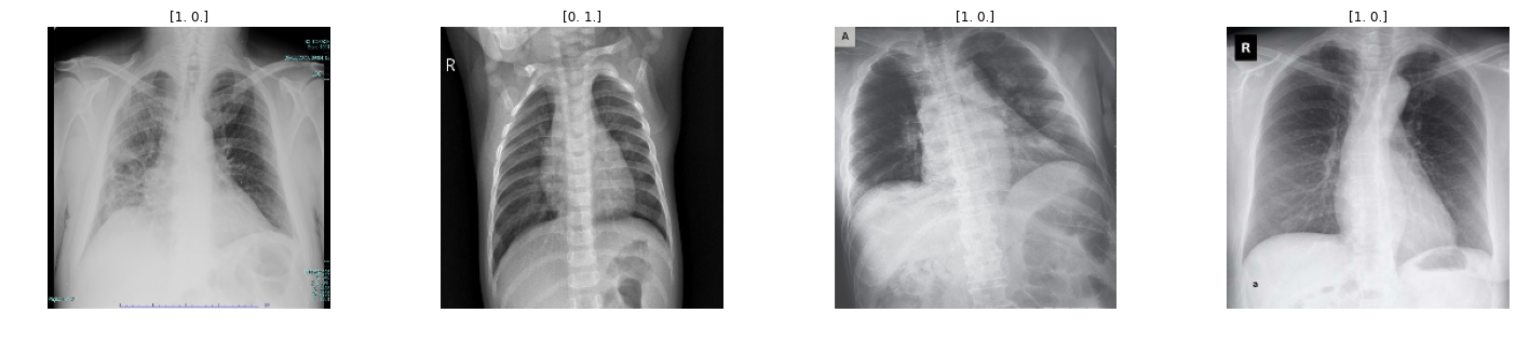
Here the output shows only the first row. But, you will get the output according to your range.
Step-8: Train and Compile the model
opt = Adam(lr=INIT_LR, decay=INIT_LR / EPOCHS)
model.compile(loss="binary_crossentropy", optimizer=opt,metrics=["accuracy"])
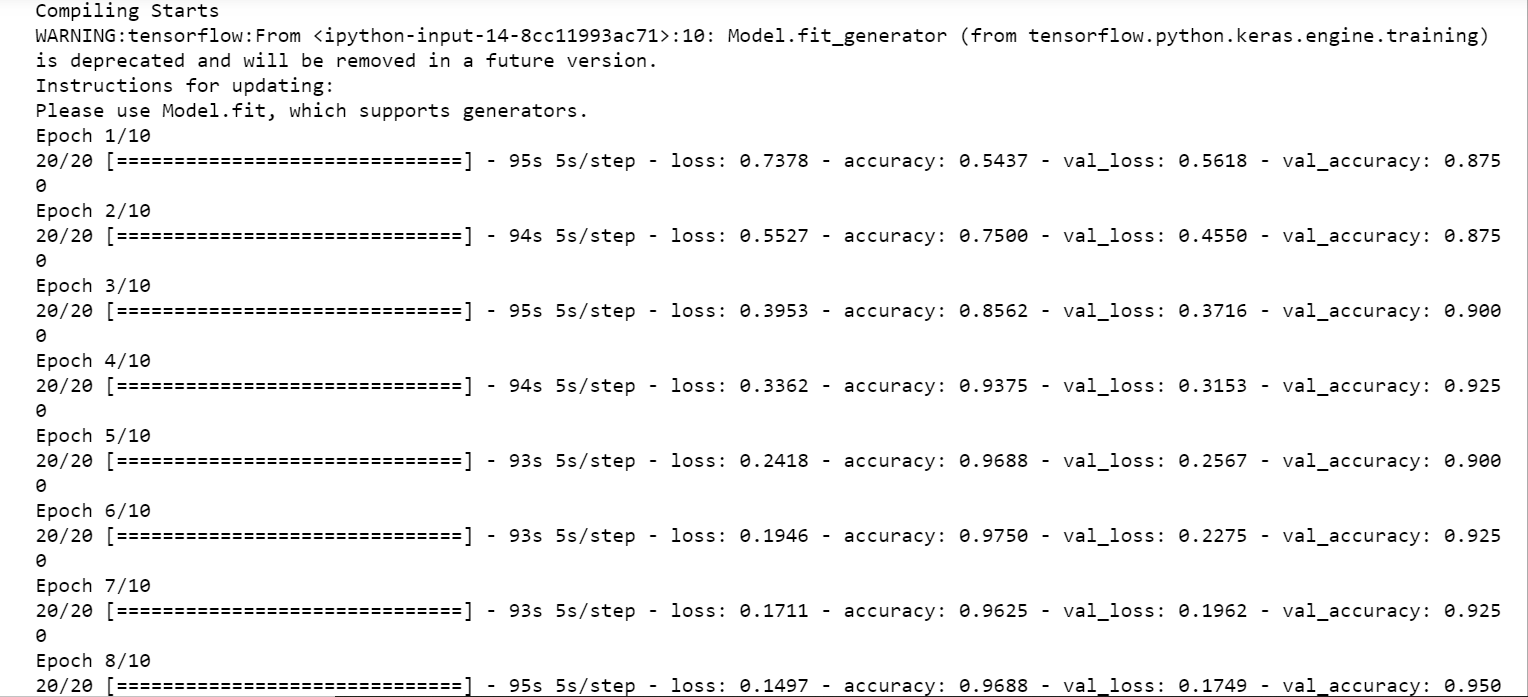
print("Compiling Starts")
R = model.fit_generator(
trainAug.flow(X_train, Y_train, batch_size=BS),
steps_per_epoch=len(X_train) // BS,
validation_data=(X_test, Y_test),
validation_steps=len(X_test) // BS,
epochs=EPOCHS)
Output:
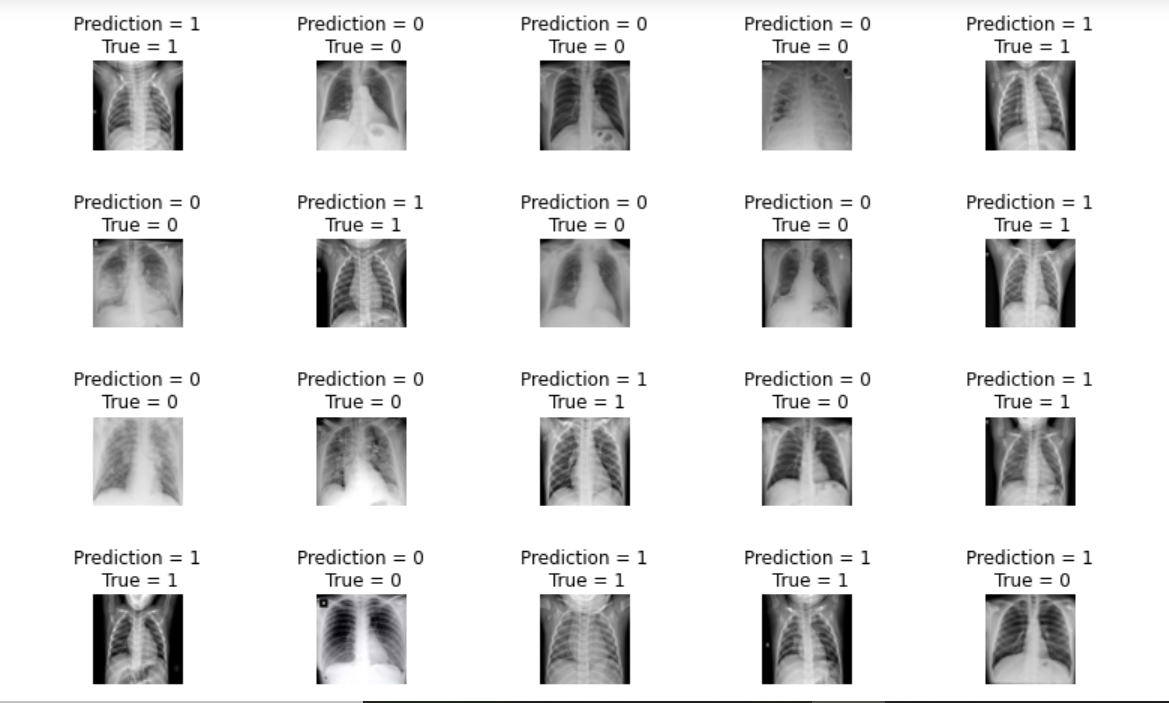
Step-9: Predict the test set and compare it with the test data.
L = 6
W = 5
fig, axes = plt.subplots(L, W, figsize = (12, 12))
axes = axes.ravel()
y_pred = model.predict(X_test, batch_size=BS)
for i in np.arange(0,L*W):
    axes[i].imshow(X_test[i])
    axes[i].set_title('Prediction = {}\n True = {}'.format(y_pred.argmax(axis=1)[i], Y_test.argmax(axis=1)[i]))
    axes[i].axis('off')
plt.subplots_adjust(wspace = 1, hspace=1)
Output:
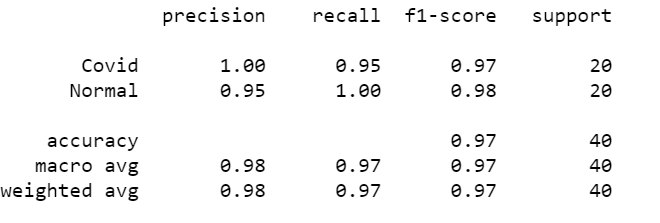
Last Step: Get the classification report and accuracy.
from sklearn.metrics import classification_report
y_pred = model.predict(X_test, batch_size=BS)
y_pred = np.argmax(y_pred, axis=1)
print(classification_report(Y_test.argmax(axis=1), y_pred,target_names=LB.classes_))
Output:
On the other hand, Construct the Confusion Matrix.
from sklearn.metrics import confusion_matrix
cm = confusion_matrix(Y_test.argmax(axis=1), y_pred)
total = sum(sum(cm))
acc = (cm[0, 0] + cm[1, 1]) / total
sensitivity = cm[0, 0] / (cm[0, 0] + cm[0, 1])
specificity = cm[1, 1] / (cm[1, 0] + cm[1, 1])
print(cm)
print("acc: {:.4f}".format(acc))
print("sensitivity: {:.4f}".format(sensitivity))
print("specificity: {:.4f}".format(specificity))
Output:
[[19  1]
 [ 0 20]]
acc: 0.9750
sensitivity: 0.9500
specificity: 1.0000
So we got a good accuracy of around 97%. in short with 39 correct predictions, and 1 incorrect prediction.
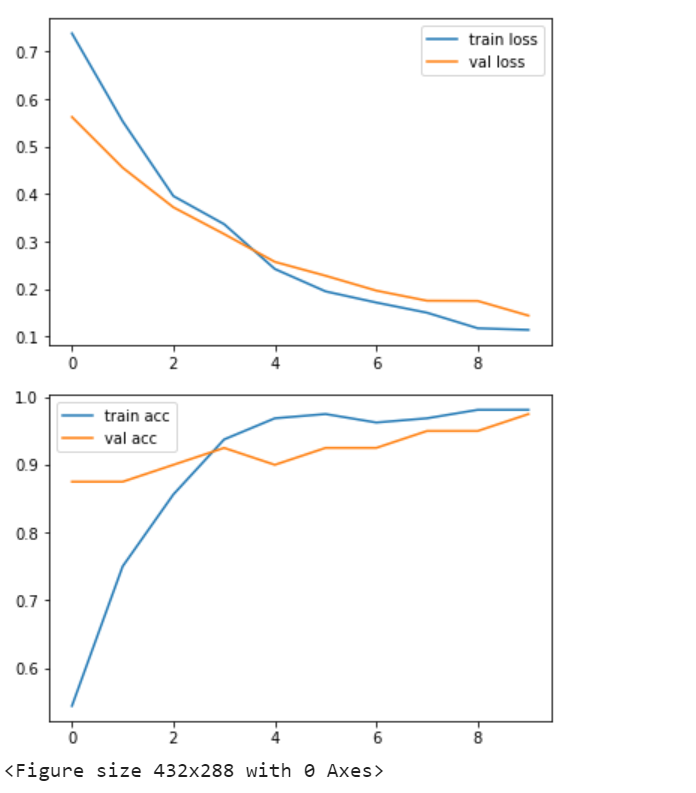
Plot the loss and accuracy
# plot the loss
plt.plot(R.history['loss'], label='train loss')
plt.plot(R.history['val_loss'], label='val loss')
plt.legend()
plt.show()
plt.savefig('Validation_loss')

# plot the accuracy
plt.plot(R.history['accuracy'], label='train acc')
plt.plot(R.history['val_accuracy'], label='val acc')
plt.legend()
plt.show()
plt.savefig('Validation_accuracy')
Output:
Let’s Check Our Model
Firstly Save the model.
import tensorflow as tf
from keras.models import load_model
model.save('Covid_model.h5')
After that, Load and compile the model.
import tensorflow as tf
model = tf.keras.models.load_model('Covid_model.h5')
model.compile(loss='binary_crossentropy',
              optimizer='rmsprop',
              metrics=['accuracy'])
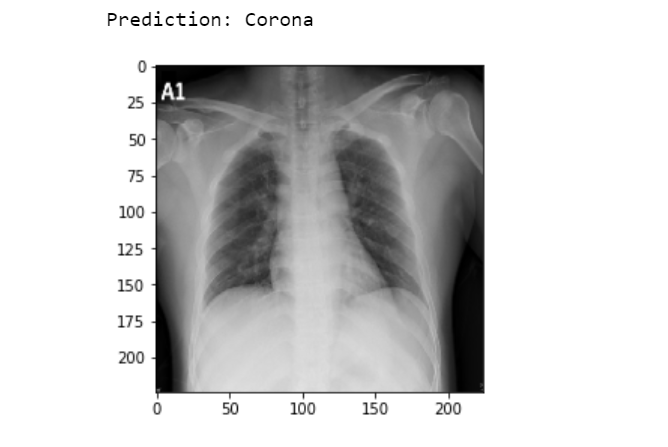
Test the model with a new data
from keras.preprocessing import image
from keras.models import load_model
from keras.applications.vgg16 import preprocess_input
img = image.load_img('Data/Covid/1-s2.0-S1684118220300682-main.pdf-002-a1.png', target_size=(224, 224)) #insert a random covid-19 x-ray image
imgplot = plt.imshow(img)
x = image.img_to_array(img)
x = np.expand_dims(x, axis=0)
img_data = preprocess_input(x)
classes = model.predict(img_data)
New_pred = np.argmax(classes, axis=1)
if New_pred==[1]:
  print('Prediction: Normal')
else:
  print('Prediction: Corona')
Output:
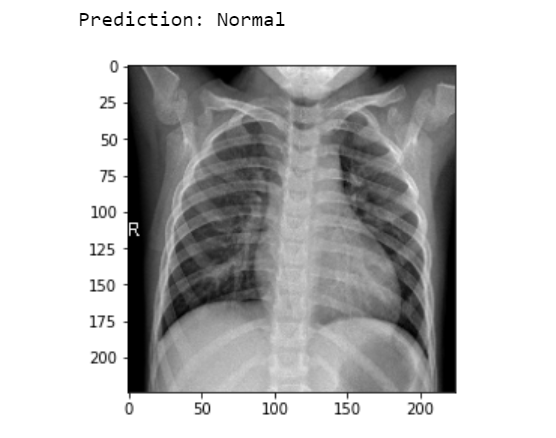
Let’s check another.
img = image.load_img('Data/Normal/IM-0162-0001.jpeg', target_size=(224, 224)) #insert a random normal x-ray image
imgplot = plt.imshow(img)
x = image.img_to_array(img)
x = np.expand_dims(x, axis=0)
img_data = preprocess_input(x)
classes = model.predict(img_data)
New_pred = np.argmax(classes, axis=1)
if New_pred==[1]:
  print('Prediction: Normal')
else:
  print('Prediction: Corona')
Output:
To get the full code Click here.
Conclusion
Thanks! for reading this article. In short, this model is for educational purposes only.
Also, read the loan prediction project
Seriously awesome work girl
I ran the dataset script to select covid-19 images from the images folder and it does not copy the images in the new folder. I get no error or anything.
import pandas as pd
import shutil
import os
# Selecting all combination of ‘COVID-19’ patients with ‘PA’ X-Ray view
coronavirus = “COVID-19” # Virus to look for
x_ray = “PA” # View of X-Ray
metadata = “data/cohen/metadata.csv” # Metadata.csv Directory
imageDir = “data/cohen/images” # Directory of images
outputDir = ‘data/cohen/Covid’ # Output directory to store selected images
metadata_csv = pd.read_csv(metadata)
# loop over the rows of the COVID-19 data frame
for (i, row) in metadata_csv.iterrows():
if row[“finding”] != coronavirus or row[“view”] != x_ray:
continue
filename = row[‘filename’].split(os.path.sep)[-1]
filePath = os.path.sep.join([imageDir, filename])
shutil.copy2(filePath, outputDir)
print(‘Done’)
this is my code. Can you see any mistake?