Bar Chart in Pygal
 By Varsha Neelamma
Visualization of data using graphs and charts not only provides better understanding but also helps in representing complex data in simple ways. You can visualize the data in different ways like plots, graphs, charts etc.
A Bar Chart is a chart that involves rectangular bars and columns for data representation. You can plot a bar chart either vertically or horizontally. The best use case of a bar chart is for the comparison of different data values.
Pygal is a module of Python that facilitates creates of differently styled graphs and charts. In this tutorial, you will learn about the options for bar charts in Pygal.
Pygal in Python
It is a Python module that is useful for the creation of interactive visual data like plots and graphs. It allows Scalar Vector Graphics(SVG) which are customizable based on the specific needs of the application. Another significant advantage is that SVG images support scalability and hence are simple to download and store. Also, Pygal uses very shortcodes making implementation of graphs easier.
You can use the Pygal package by installing it by running the below command on the terminal.
pip install Pygal
Note: Pygal is supported only in Python versions 2.7 and above.
Some of the other Python dependencies that you may require while working with Pygal:
- lxml
- cairosvg
- tinycss
- cssselect
You can install the same by using the pip command on the terminal.
Making of Bar chart in Pygal
- Vertical Bar Graph:
It is the basic and most simple graph and hence its usage is very common. Such graphs are useful for the comparison of different sets of data. It is usually recommended for ordinal(sequential variables).import pygal import numpy vert_bar_chart = pygal.Bar() vert_bar_chart.title = 'A Sample Vertical Bar Chart' vert_bar_chart.add('Team 1', numpy.random.rand(10)) vert_bar_chart.add('Team 2', numpy.random.rand(10)) vert_bar_chart.add('Team 3', numpy.random.rand(10)) vert_bar_chart.add('Team 4', numpy.random.rand(10)) vert_bar_chart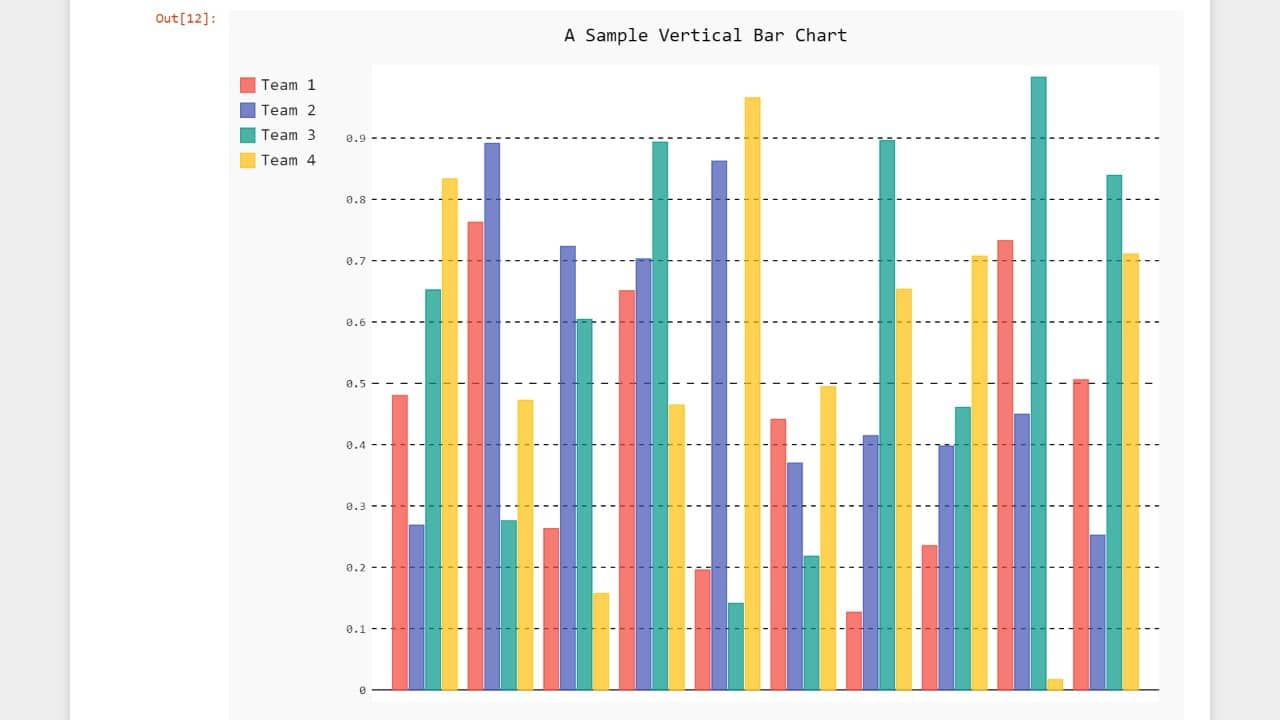
- Horizontal Bar Graph:
It is the same as a Vertical graph but uses horizontal bars. The data is displayed parallel to each other.import pygal import numpy hori_bar_chart = pygal.HorizontalBar() hori_bar_chart.title = 'A Sample Horizontal Bar Chart' hori_bar_chart.add('Team 1', numpy.random.rand(10)) hori_bar_chart.add('Team 2', numpy.random.rand(10)) hori_bar_chart.add('Team 3', numpy.random.rand(10)) hori_bar_chart.add('Team 4', numpy.random.rand(10)) hori_bar_chart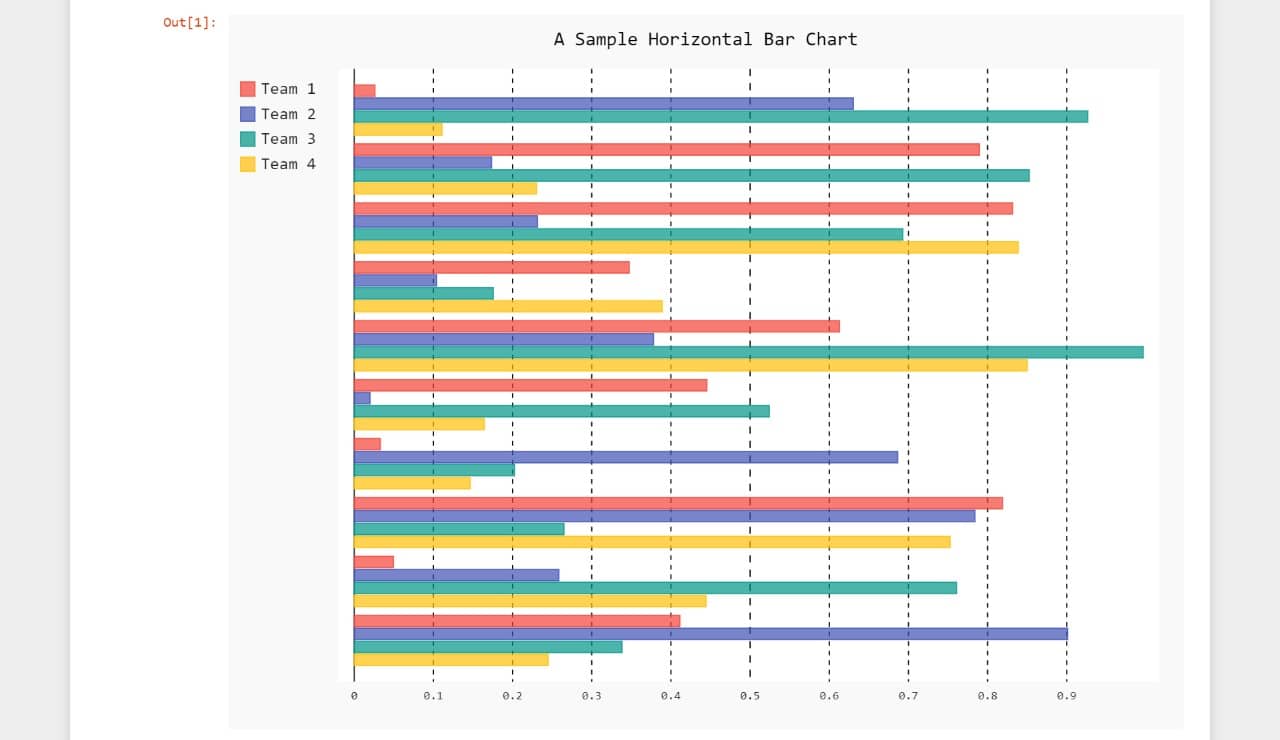
- Stacked Bar Graph:
It is very similar to the other graphs but the values are stacked here.import pygal import numpy stacked_bar_chart = pygal.StackedBar() stacked_bar_chart.title = 'A Sample Stacked Bar Chart' stacked_bar_chart.add('Team 1', numpy.random.rand(10)) stacked_bar_chart.add('Team 2', numpy.random.rand(10)) stacked_bar_chart.add('Team 3', numpy.random.rand(10)) stacked_bar_chart.add('Team 4', numpy.random.rand(10)) stacked_bar_chart
Key Notes:
- You can use the render_in_browser() method to display the bar graph in a new browser window.
An example for the same:import pygal import numpy vert_bar_chart = pygal.Bar() vert_bar_chart.title = 'A Sample Vertical Bar Chart' vert_bar_chart.add('Team 1', numpy.random.rand(10)) vert_bar_chart.add('Team 2', numpy.random.rand(10)) vert_bar_chart.add('Team 3', numpy.random.rand(10)) vert_bar_chart.add('Team 4', numpy.random.rand(10)) #vert_bar_chart vert_bar_chart.render_in_browser()file://C:/Users/varsh/AppData/Local/Temp/tmpisd41bl4.html
This plots the graph on a new browser page.
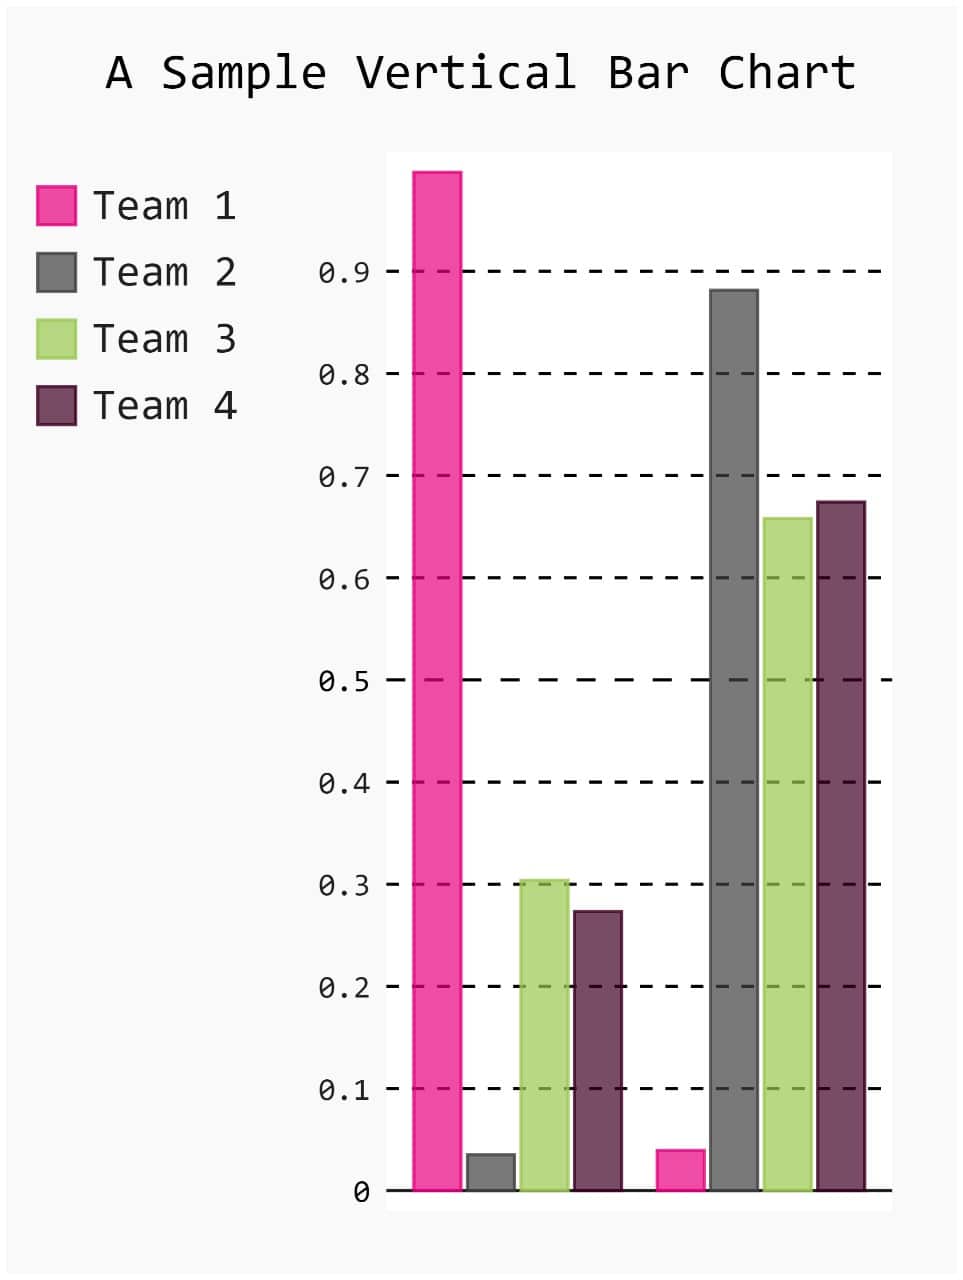
- You can also specify the attributes such as height, width, style while defining the graph. You can observe the same below:
import pygal
import numpy
from pygal.style import Style
chartstyle = Style(colors=('#E80080', '#404040', '#9BC850'))
vert_bar_chart = pygal.Bar(height=400,width = 300,style=chartstyle)
vert_bar_chart.title = 'A Sample Vertical Bar Chart'
vert_bar_chart.add('Team 1', numpy.random.rand(2))
vert_bar_chart.add('Team 2', numpy.random.rand(2))
vert_bar_chart.add('Team 3', numpy.random.rand(2))
vert_bar_chart.add('Team 4', numpy.random.rand(2))
vert_bar_chart
For this, you must not forget to import the Style library of the Pygal module first.
You can also export the graph as an SVG file and download it to your system.
-
import pygal
import numpy
from pygal.style import Style
chartstyle = Style(colors=('#E80080', '#404040', '#9BC850'))
vert_bar_chart = pygal.Bar(height=400,width = 300,style=chartstyle)
vert_bar_chart.title = 'A Sample Vertical Bar Chart'
vert_bar_chart.add('Team 1', numpy.random.rand(2))
vert_bar_chart.add('Team 2', numpy.random.rand(2))
vert_bar_chart.add('Team 3', numpy.random.rand(2))
vert_bar_chart.add('Team 4', numpy.random.rand(2))
vert_bar_chart.render_to_file('Vertical bar chart.svg')
You will then see that the file is present in the current directory.
Pygal also allows you to work on other types of graphs like pie graphs, line graphs, histograms, etc. You can explore the same if you are interested.
You can find the official documentation for Pygal by clicking Pygal.
Leave a Reply