Text Clustering using K-Means with Sklearn
 By Om Tejaswini
K-Means Clustering Algorithm:
K-Means clustering is a machine learning method that helps to organize data into groups based on how similar or different they are. The goal is to divide the data into K clusters, with each data point belonging to the cluster that has the closest center.
Working Of K-Means:
- Start by picking K random points as the initial cluster centers.
- Assign each data point to the nearest cluster center using Euclidean distance.
- Once all points are assigned, recalculate the centers of each cluster by finding the mean of all the points in that cluster.
- Update the cluster centers to these new means.
Repeat these steps until the cluster centers don’t change anymore or until you’ve repeated the process several times.
Implementing text clustering in Python
Importing necessary libraries
import pandas as pd
from sklearn.feature_extraction.text import TfidfVectorizer
from sklearn.cluster import KMeans
from sklearn.decomposition import PCA
from sklearn.manifold import TSNE
from nltk.corpus import stopwords
from nltk.tokenize import word_tokenize
import nltk
import matplotlib.pyplot as plt
import numpy as np
Reading dataset (IMDB reviews dataset)
The dataset can be downloaded using this link:
https://www.kaggle.com/datasets/lakshmi25npathi/imdb-dataset-of-50k-movie-reviews
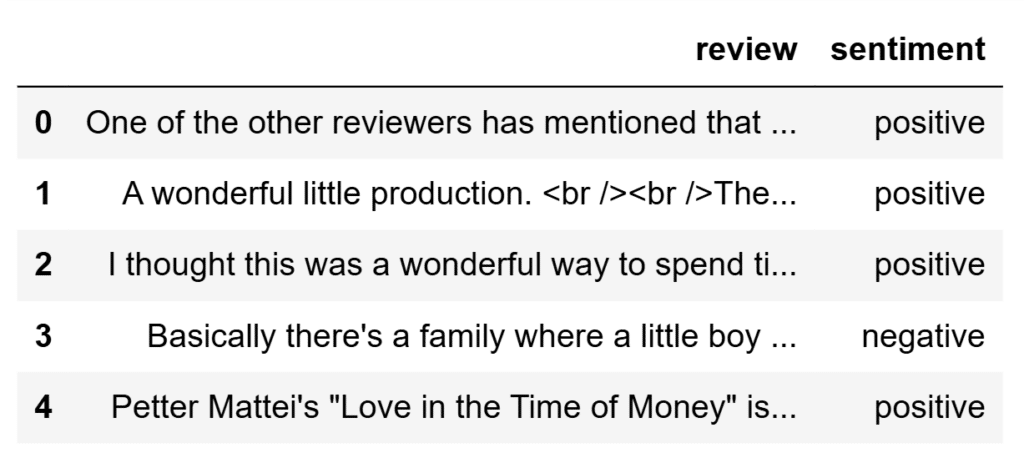
df=pd.read_csv('IMDB Dataset.csv')
df.head()
Output:
Preprocessing the text data
- Lowercasing
Convert all the words to lowercase because the case of the word doesn’t signify any meaning. - Tokenization
Splitting the text data into individual words/tokens. - Removing stop words
Stop words are common words like is, and, was, the, etc., that do not contribute much to the sentence’s meaning Removing those words doesn’t change the sentence’s meaning.
stop_words = set(stopwords.words('english'))

def preprocess(text):
    tokens = word_tokenize(text.lower())
    filtered_tokens = [word for word in tokens if word.isalnum() and word not in stop_words]
    return ' '.join(filtered_tokens)
reviews = df['review'].tolist()
preprocessed_reviews = [preprocess(review) for review in reviews]
preprocessed_reviews[0]
Vectorizing the text data
Converting text data into numerical forms is vectorizing. Two frequently used methods are: 1) Bag of Words, and 2) TF-IDF (Term Frequency-Inverse Document Frequency). Here I used the TF-IDF method.
TF-IDF: Frequency of words against documents, which gives more weightage to the words unique to each document.
vectorizer = TfidfVectorizer(max_features=5000)
X = vectorizer.fit_transform(preprocessed_reviews)
Dimensionality reduction
TF-IDF gives sparse and high-dimensional vectors. Since high dimensionality is not efficient for computation, dimensionality is reduced using PCA.
pca = PCA(n_components=2)
X_pca = pca.fit_transform(X.toarray())
Clustering the text
Then we cluster the data using K-Means. Since we have two clusters we give K value as 2.
num_clusters = 2
kmeans = KMeans(n_clusters=num_clusters)
kmeans.fit(X)
Visualizing the resulting clusters
After we cluster the data, the data will be divided into two categories, and each category will be a cluster. We visualize the clusters using Matplotlib where each color represents a cluster.
df['cluster'] = kmeans.labels_
pca_df = pd.DataFrame(X_pca, columns=['x', 'y'])
pca_df['cluster'] = df['cluster']
colors = ['red', 'green']
cluster_labels = ['Negative', 'Positive']

plt.figure(figsize=(8, 6))
for i in range(num_clusters):
    plt.scatter(
        pca_df[pca_df['cluster'] == i]['x'],
        pca_df[pca_df['cluster'] == i]['y'],
        s=10,
        color=colors[i],
        label=cluster_labels[i]
    )
plt.legend()
plt.title('Visualization of IMDB Reviews Clusters')
# plt.xlabel('PCA feature 1')
# plt.ylabel('PCA feature 2')
plt.show()
Output:

Leave a Reply