Sankey diagram in Python
 By Pranit Sawant
In this tutorial, we will learn about what is Sankey diagram and what the use of the Sankey diagram. We will also learn about what libraries are used to plot Sankey diagrams and how to plot Sankey diagrams using those libraries.
What is the Sankey diagram?
Sankey diagram is used to represent flows between different entities(variables). These flows are relationships between different variables in the data. It contains two main components nodes and arrows. Nodes are the entities in the given system (data). Arrows indicate the relationship between two nodes. They indicate how information flows between different variables.
What is the use of the Sankey diagram?
- Allocation of resources
- The flow of data over different system
- Optimize the production process
- Supply chain management
- The flow of material through different stages of production
What are the different libraries to plot the Sankey diagram How to install those libries?
We can plot the Sankey diagram using,
- Matplolib
- Plotly
We can install the above libraries using the pip command in Python in Jupyter Notebook as follows
pip install matplotlib plotly
In the above code, we are installing two separate libraries using a single command.You can also use two separate pip commands to install the libraries. The code will install the latest version of Matplolib and Plotly libraries in our system.
How to plot the Sankey diagram?
1) Using matplolib
Importing required libraries
import matplotlib.pyplot as plt
from matplotlib.sankey import Sankey
Defining the data
flows = [0.13, 0.1, 0.20, -0.15, -0.25, -0.1, -0.3, -0.05]
labels = ['', '', '', 'A', 'B', 'C', 'D', 'E']
orientations = [-1, 1, 0, 1, 1, 1, 0, -1]
In the above code, we are defining flow values, Node labels, and orientation.
Flows values are the values between nodes. Positive values are for incoming flows and negative values are for outgoing nodes.
Labels are node labels and orientations indicating the direction of the node. +1 means toward the right,-1 toward the left, and 0 means in a straight line( horizontal flow).
Plotting diagram
fig, ax = plt.subplots()
sankey = Sankey(ax=ax, unit=None)
sankey.add(flows=flows, labels=labels, orientations=orientations, trunklength=1)
diagrams = sankey.finish()
plt.title("Sankey Diagram with Different Values")
plt.show()
In the above code, .Sankey() method, we are using to initialize the Sankey diagram. It takes the ‘ax’ paramter value as ax. Using .add() method we are providing parameters with values that we defined. The trunklength parameter indicates the length of the horizontal flow we can change it according to our requirements. Finally, we are customizing the graph by adding the title to the graph.
Output

2) Using Plotly
Importing required libraries
import plotly.graph_objects as go
Defining data
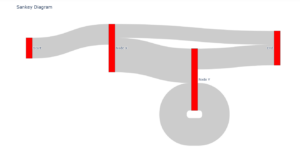
data1=go.Sankey(node=dict(pad=15,thickness=20,label=["Start", "Node X", "Node Y", "End"],color="red"),
    link=dict(source=[0, 1, 1, 2, 2],target=[1, 2, 3, 2, 3],value=[15, 25, 10, 20, 15]))
In the above, we are creating data using the go.sankey() method which takes dictionaries as parameter values for parameters named node and link. In the link parameter, the source indicates the origin of the flow, the target indicating the destination of the flow and values are the quantities in between the flow.
Plotting graph
fig = go.Figure(data=data1)
fig.update_layout(title_text="Sankey Diagram", font_size=10)
fig.show()
We are creating a fig object for further customization of the graph. We are passing our created data1 dataset to the data parameter in the diagram.
Output
Leave a Reply