Maximum Likelihood Estimation (MLE) in Python
 By Yathartha Rana
In this tutorial, we will learn about a very important topic often used in statistics: Maximum Likelihood Estimation. Firstly, we will explore the theory and then will apply our theoretical knowledge through Python.
What is MLE?
Maximum Likelihood Estimation (MLE) is a method for estimating the parameters of the probability distribution. For example, take normal probability distribution, and its parameters are mean and standard deviation. The width and shape of the probability distribution will be dependent on these parameters. Given the dataset, which contains random data, how will you calculate these parameters? That’s where estimation plays a role.
Generally, estimations like sample mean estimation or sample standard deviation estimation are used, which calculate the mean and standard deviation directly from the dataset. But here comes the problem: these estimations assume that the dataset variables are in a linear relationship to each other, which is not the case most of the time. Also, the value of parameters from these estimations doesn’t guarantee maximum accuracy. So, here comes our hero, MLE. It works on the simple concept that chooses the values of parameters based on the dataset that is most probable under the model. To find how probable the given data is under different parameters, the likelihood function is used.
If you still have problems interpreting, consider this example: Take a coin and toss it 10 times. We don’t know whether the coin is biased or unbiased, so we don’t know the probability of getting a head or tail. Suppose the head comes 6 times out of 10. Now, our likelihood function will tell how likely it is to observe this scenario for different values of probability of getting heads.
Mathematics
Suppose you have a dataset, X = {x1,x2,x3 …… xn} consisting of n independent and identically distributed observations for some probability distribution having parameter Θ. The likelihood function L(Θ|X) is defined as
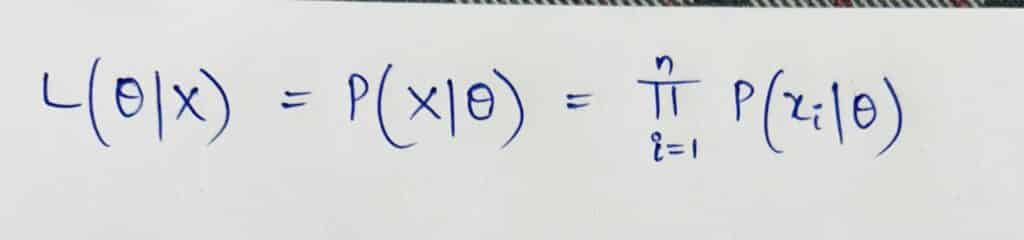
where P(xi|Θ) is the probability of observing xi given the parameter Θ. For continuous probability distributions, this probability is replaced by the probability density function (pdf), and the product becomes the product of densities. We take the log-likelihood function because the product of densities will be very small.

Now, since the logarithm function is strictly increasing, it will not impact the likelihood function when we maximize it. We can simply maximize the log-likelihood function with respect to Θ and still get the same estimated parameters.
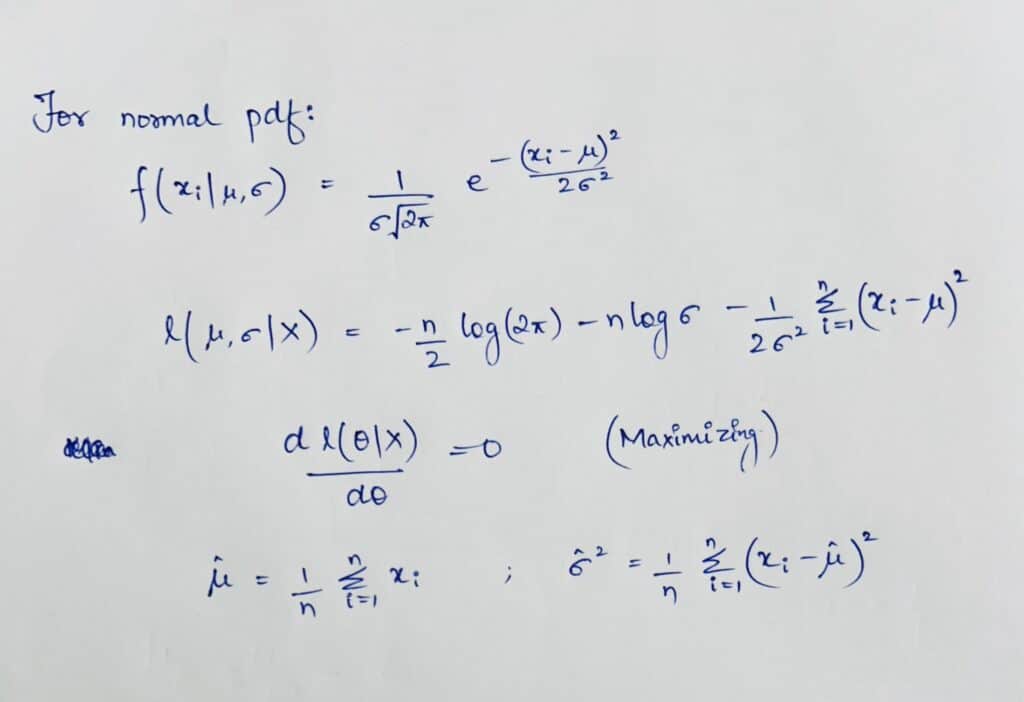
Take the example of the normal probability distribution function:
Python code: Maximum Likelihood Estimation
Let’s estimate the parameters of the normal probability distribution function. First, we will generate the data in accordance with the normal probability distribution function and then we will estimate the parameters.
Make sure you have scipy library installed in your system. If not, install it from the below command:
pip install scipy
import numpy as np
from scipy.optimize import minimize
from scipy.stats import norm

# Generating sample data according to normal pdf
np.random.seed(0)
true_mu = 0
true_sigma = 1
data = np.random.normal(true_mu, true_sigma, 1000)

# Defining the likelihood function

def neg_log_likelihood(params):
    mu, sigma = params[0], abs(params[1])
    likelihood = -np.sum(norm.logpdf(data, mu, sigma))
    return likelihood

# Initial guesses for mu and sigma
initial_guess = [0, 1]

# Minimize the negative log-likelihood
result = minimize(neg_log_likelihood, initial_guess, method='L-BFGS-B')

estimated_mu, estimated_sigma = result.x
print(f"Estimated mu: {estimated_mu}")
print(f"Estimated sigma: {estimated_sigma}")
Output
Estimated mu: -0.04525564977107271
Estimated sigma: 0.9870333422579031
Code Explanation
Since the scipy library doesn’t have a built-in function to maximize a function, we have converted the log-likelihood function into a negative and will minimize it. In other words, we are maximizing the log-likelihood function. We have considered initial guesses for mean and standard deviation as 0 and 1, respectively.
The L-BFGS-B is an optimization method used when we have to either maximize or minimize non-linear functions.
Leave a Reply