Map visualization with Folium in Python
 By Pranit Sawant
In this tutorial, we will learn how to create visualizations using Folium in Python. We will also learn about how to customize the map and add markup and pop-ups to the map to make it more interactive and informative.
What is Folium?
It is a Python library that helps us to visualize geospatial data. It gives interactive maps with which users can easily interact and extract information. We can use coordinates of the longitude and latitude of any place in the world and visualize it using folium. We will create maps showing unemployment in a particular county, poverty rates as well as education, and economic conditions of any place in the world. Some of which we are going to visualize here.
Also check: Draw maps using latitude and longitude using folium in Python
How to install the Folium library?
If you don’t have Folium in your system you can install it using a simple command using pip as follows:
- Using pip in jupyter notebook or command prompt.
pip install folium
It will install the Folium library with the latest version.
Create Visualization:
import folium

map1 = folium.Map(location=(19.0760, 72.8777))

map1
The first value indicates Latitude and the second value is Longitude in the location parameter. The above code will show Mumbai on the map as the coordinates are for Mumbai. In the above code, the first value indicates Latitude and the second value is Longitude
Output:

The above map will show Mumbai as the coordinates are for Mumbai.
How to save the map?
We can save our map for future use using the simple command below:
map1.save('mumbai_map.html')
To visualize the above map we have to just open it by double clicking on the html file in the folder. It will open the map in the browser and we will able to interact with it easily.
Setting tileset to the map: Folium
What are titles?
We can see it as a theme feature in Google Maps. We have terrain, and satellite themes in Google Maps. Similarly, we can set a theme here.
By default, the map has “OpenStreetMap”. We can set other themes like stamen Terrain, CartoDB Position, etc.
See following code using =”CartoDB Positron”
import folium

map1 = folium.Map(location=(19.0760, 72.8777),tiles="CartoDB Positron", zoom_start=10)

map1
Output:

The zoom_start parameter will show what our map looks like when you visualize it first. more the value to the parameter the Zoom view to the map. You can change values and see the results.
Let’s add markers to the map to make it more informative:
What is a marker?
See the map we first visualized. It is difficult to see Mumbai at first glance. We can solve this using a marker. Marker is icons or symbols on the map that provide additional information and also make it easy to locate the place while reading a map.
import folium

map1 = folium.Map(location=(19.0760, 72.8777), zoom_start=10)

folium.Marker( location=[19.0760, 72.8777],tooltip="I am a marker",popup="This is Mumbai",icon=folium.Icon(icon="cloud",color="green")).add_to(map1)

map1
Output:
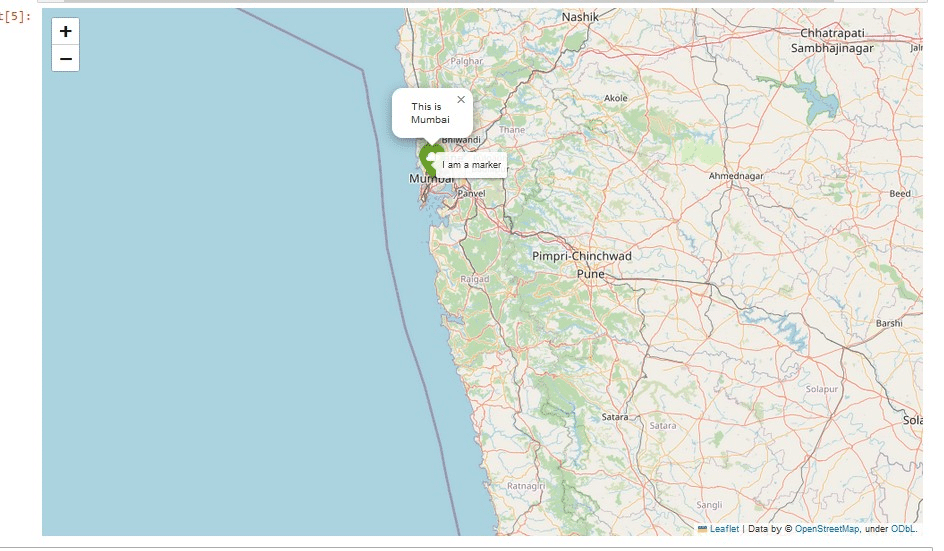
In the above, We can change the values of parameters and can change the marker style of our choice. See the documentation for more information.
Grouping and controlling in Folium
It helps us to create groups of certain things like restaurants, tourist spots, etc on the map. It groups markers into the group of feature groups. We can organize the categories using grouping in folium.
The layer control will add the checkbox on the upper right corner of the map from where we can select or deselect the categories on the map.
import folium

map1 = folium.Map(location=(19.0760, 72.8777), zoom_start=10

group1 = folium.FeatureGroup("Tourist Spots").add_to(map1)

folium.Marker(location=(19.0760, 72.8777), icon=folium.Icon(color="red")).add_to(group1)

folium.Marker(location=(19.0445, 72.8108), icon=folium.Icon(color="red")).add_to(group1)

group2 = folium.FeatureGroup("Restaurants").add_to(map1)

folium.Marker(location=(19.0773, 72.8632), icon=folium.Icon(color="green")).add_to(group2)

folium.Marker(location=(19.0742, 72.8675), icon=folium.Icon(color="green")).add_to(group2)

folium.LayerControl().add_to(map1)

map1
Output:

In the above visualization, you can see in the upper right corner there is a symbol. By clicking on it we will be able to select or deslect the groups.
Now you are ready to make visualizations using the Folium library.
There are some advanced visualization techniques too. Like GeoJSON/TopoJSON layers. which overlays GeoJSON or TopoJSON data on the map.
You can refer to the folium documentation.
https://python-visualization.github.io/folium/latest/index.html
Leave a Reply