Hypergeometric distribution in Python
 By Yathartha Rana
In this tutorial, we will learn about another probability distribution in our statistics referred as Hypergeometric distribution in Python. First we will see the mathematical theory and then we will apply in our favorite language Python.
Hypergeometric distribution
This probability distribution describes the probability of number of success in a fixed number of draws without replacement from a fixed sample size. So, basically, it deals with numbers of successes and failures. The sample size is denoted by N and number of draws is denoted by n. This distribution is non-continuous unlike the distributions you have studied in statistics. So, for this distribution we have Probability Mass Function instead of Probability density function.

Let’s understand the distribution from the example.
Suppose you have an unbiased deck of cards. You want to draw 5 cards from it. What is the probability that you draw d Diamond cards?
To calculate this, we have N = 52, n = 5, K = 13. Simply put in the formula and we can get the probability. K represents the total number of items of the desired type in the sample.
Python Code
Let’s calculate the probabilities of getting different number cards in 5 draws. Our possibilities will include 0 Diamond cards in 5 draws, 1 Diamond, 2 Diamond, 3 Diamond, 4 Diamond and 5 Diamond cards. From our common sense, we can say that the probability of 5 Diamond cards in 5 draws will be very less. Let’s verify using the code.
import numpy as np
import matplotlib.pyplot as plt
from scipy.stats import hypergeom

# Define parameters
N = 52
K = 13
n = 5
x_values = np.arange(0, n+1)  # possible number of successes in the sample 0 Diamond card, 1 Diamond card .... 5 Diamond cards


pmf_values = hypergeom.pmf(x_values, N, K, n)


plt.bar(x_values, pmf_values)

for x, y in zip(x_values, pmf_values):
    plt.text(x, y, f'{y:.3f}', ha='center', va='bottom')

plt.title('Hypergeometric Distribution PMF')
plt.xlabel('Number of Successes in Sample')
plt.ylabel('Probability')
plt.xticks(x_values)
plt.grid(False, axis='y')
plt.show()
Output
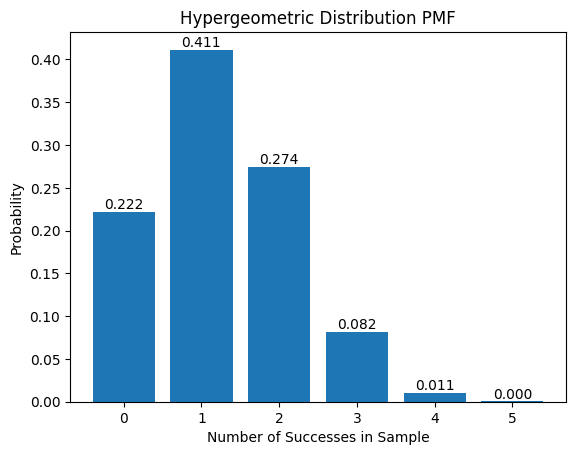
From the plot, we can see the different probabilities of getting different number of Diamond cards in 5 draws. The probability of getting 1 Diamond card in 5 draws, is most likely to occur whereas 5 Diamond cards in 5 draws is least likely with probability of 0.
Leave a Reply