Geospatial analysis using Python
 By Pranit Sawant
In this tutorial, we will learn about what is geospatial analysis, the Applications of geospatial analysis, and the key libraries to perform geospatial analysis using Python. We will also see a geospatial analysis of data using one of the Python libraries.
What is geospatial analysis?
It is an analysis performed on geospatial data. Geospatial data also called spatial data is the type of data that contains information about the geographic location of a country, state, or any other place on the Earth in terms of longitude or latitude. In geospatial analysis we can locate a particular area also we can calculate the size, length, or other attributes of the area.
Application of geospatial analysis
- Natural resource allocation and management
- Agricultural management.
- Urban development
- Transportation
- Military management
- Study of climate, crimes, Business, real estate, etc.
What are the libraries we use for geospatial analysis in Python?
- Geopandas: It is an extended version of the panda’s library. It gives geodataframe like dataframe in pandas. It helps to simplify working with geospatial data.
- Fiona: It helps in reading and writing in geospatial files. We can write geospatial data in GeoJSON, Shapefiles, etc. format.
- Shapely: It allows us to perform geometric operations in Geospatial data. We can modify, and create points, lines, etc on the map.
- Folium: We can create interactive maps using folium. We can add markers, and visualize different locations on a map using Folium.
Which is the widely used library for geospatial analysis?
Geopandas is the widely used library to perform analysis on geospatial data. Sometimes Geopandas can be used combined with Shapely, Fiona, etc. to perform analysis.
How to perform geospatial analysis using Python?
First, we will be required to install the Geopandas library, which is a widely used library to perform geospatial analysis.
We can install it using the following command in pip
pip install geopandas
This will install the geopandas library.
Now we will import the required libraries
import geopandas as gpd
import warnings
warnings.filterwarnings("ignore")warnings.filterwarnings("ignore")
In the above code geopandas we are using to read and perform analysis on geospatial data. Warning we are importing to avoid warning messages in output and our output would look very clean and neat.
To import the geospatial data and display the first five rows:
df = gpd.read_file(r'C:\Users\DELL\Desktop\world.ship)
df.head(5)
In the above code, import .shp means shapefile from the system. Shapefiles are the types of files used to store geographic information.
Output:

To get a basic idea about the data.
df.info()
This will give column names, datatype, and non-null values.
Output:

To get unique names in the NAME column:
df.NAME.unique()
This will give unique names in the NAME column.
Output:

To perform visualizations (Geospatial)
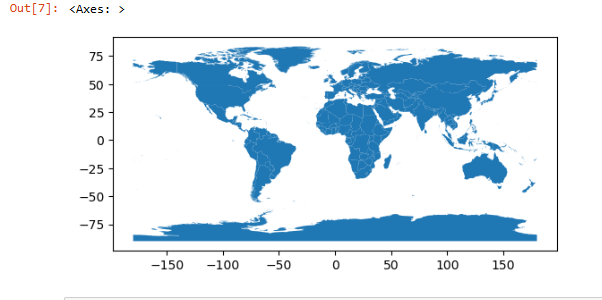
To plot all the locations in the file:
df.plot()
This will plot all the locations in the given data.
Output:
Suppose we don’t want to plot a particular area. We can do it using the following command:
df = df[df['NAME'] != 'India']
df.plot()
This will give output without India on the map.
Output:

To visualize a particular country.
df[df.NAME=="Germany"].plot()
This will return Germany as output.
Output:

To select particular columns from the data:
df = df[['NAME', 'geometry']]
df.tail(3)
In the above code, the area is used to calculate the area of each country based on the geometry of the country. The above code displays the last 3 rows in the new data frame.
Output:

To create a new column name Country_area
df['Country_area'] = df.area
df.head(3)
This will create new column named Country_area which indicates the area of each country. we are using the .area command to calculate the area of each country.
Output:

To draw a map with colors
df.plot(column = 'NAME', camp = 'hsv')
In the above code, we are plotting a colormap for the column named NAME. In the above cmap=’hsv’ indicates the colormap parameter we have set with color values based on the Hue Saturation Value model which is used to represent colors in terms of Hue, Saturation, and Values.
Output:

To visualize the countries according to their size:
df['Country_area'] = df.Country_area/1000000
df.plot(column = 'Country_area' , cmap = 'hsv' , legend = True, legend_kwds = {'label': "Area of the country (in Square Kilometer)"}, figsize = (10,10))
In the above code first, we are calculating the area in terms of square kilometre and then we are plotting it using the above command. Figsize indicates the output figure size we have set is (10,10). The legend=True indicates we will be having a map with a sidebar that indicates color values and their meaning.
Output:

In the above article, we learned about basic visualization techniques using the Geopandas library. We can perform complex analysis on geospatial data using libraries like Shapely, folium Fiona, etc.
Leave a Reply