How to plot Line of Best fit in python
 By Sourav Rastogi
First, we will import libraries
import numpy as np
import matplotlib.pyplot as plt
Then we will create data points
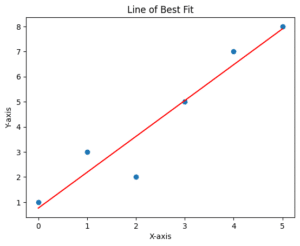
 #Create data points
x = np.array([0, 1, 2, 3, 4, 5])
y = np.array([1, 3, 2, 5, 7, 8])
Best fit line equation y = mx+b, by using np. polyfit we will calculate coefficients ( m,b), and np.poly1d will create a line using these coefficients.
coefficients = np.polyfit(x, y, 1)
line = np.poly1d(coefficients)
Now we will create a plot
plt.scatter(x, y)
plt.plot(x, line(x), color='red')
plt.xlabel('X-axis')
plt.ylabel('Y-axis')
plt.title('Line of Best Fit')
plt.show()
Leave a Reply