Create interactive maps using Latitudes and Longitudes in Python
 By Sahil Shah
I know many people might have faced problems while handling geospatial data such as latitudes and longitudes, whether it may be creating maps out of it or using it for different types of analysis or Machine Learning tasks. This tutorial will teach us the basics for creating maps using Latitudes and Longitudes with the help of Python programming.
Before going on the implementation tasks, let me first give a short overview of what are geospatial data. Geospatial data contains information related to locations on the Earth’s surface. Since Latitudes and Longitudes give us information related to different locations on the Earth’s surface, this falls under Geospatial data. One example of the geospatial data is [18.922064, 72.834641]. This represents the coordinates for the Gateway of India (Mumbai). Here the x coordinate represents the Latitude and the y coordinate represents the Longitude.
Now let’s take a look at how one can use this data and plot it on the Map.
Also read: Map visualization with Folium in Python
Interactive Maps using Latitudes and Longitudes
We will use Python Language for this task. Python’s easy and one of the most famous libraries known for this task is the Folium. So we will use Folium Maps to accomplish this task.
Let us start with the basics.
We will start by installing this library in our workspace. We will write this command in our terminal.
pip install folium
Now let us create our first map using this library.
import folium
first_map = folium.Map(location=[18.922064, 72.834641], zoom_start=25)
first_map
Output:

Here, the larger the value of the ‘zoom_start’ parameter greater is the zoom level, and vice-versa.
To make it more appealing and understandable we will add the markers using the popup parameter.
To add the popups we use the command:
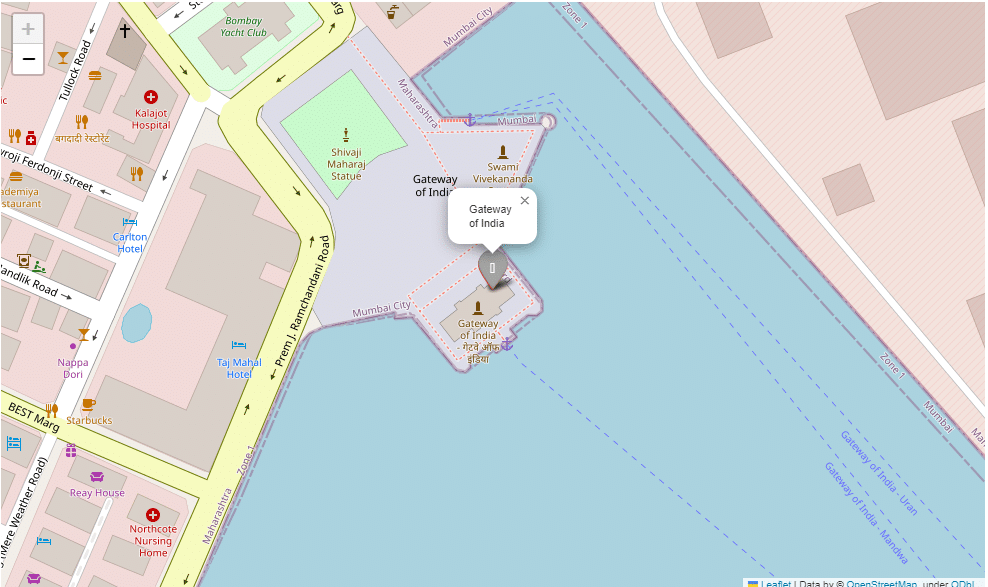
folium.Marker(location=[18.922064, 72.834641], popup="Gateway of India", icon=folium.Icon(color='lightgray', icon='fa-solid fa-archway')).add_to(first_map)
Output:
One can also add their own markers on the map by clicking it and giving it their popup messages:
first_map.add_child(folium.ClickForMarker(popup="New PLaces I will Explore"))
Output:

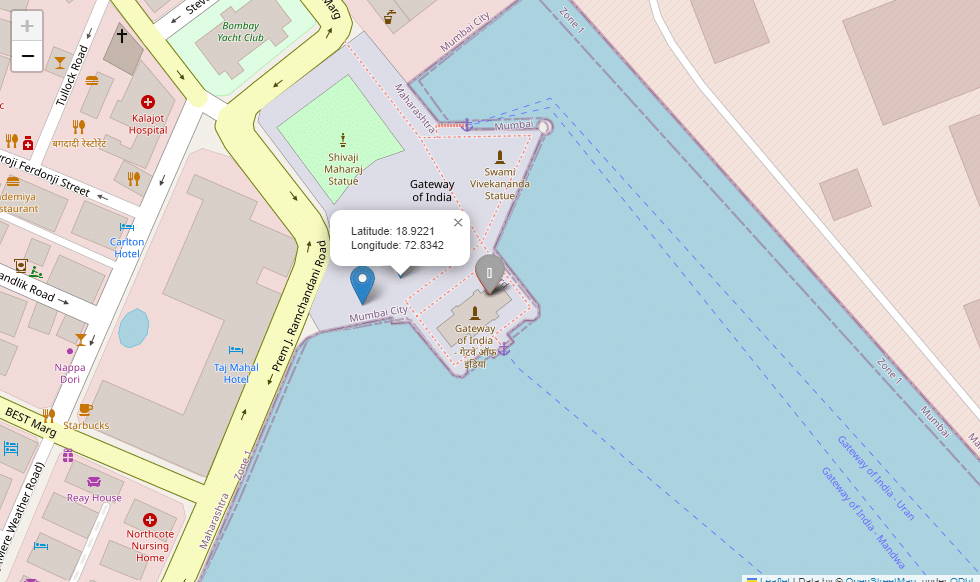
If we want to add a marker such that on clicking the map we can know the latitudes and longitudes of those places, we can do this by:
first_map.add_child(folium.LatLngPopup())
Output:
If we want to highlight certain regions on the map we can use the following commands:
first_map = folium.Map(location=[18.922064, 72.834641], zoom_start=15)
folium.Circle(
    radius=50,
    color='blue',
    location=[18.922064, 72.834641],
    fill=True
).add_to(first_map)

folium.CircleMarker(
    radius=50,
    color='red',
    location=[18.925986943755657, 72.8185991098753],
    fill=False
).add_to(first_map)
Output:

Till now we studied how to make the maps, not only interactive but also informative. Now at last we will see how to make these maps using different tile styles. Some of the free tile styles that Folium provides to us are:
- Stamen (Terrain, Toner, Watercolor)
- CartoDB(Positron and Dark Matter)
- OpenStreetMap (This is the default one we were using till now)
Today we will explore the CartoDB ‘s tile style.
It is primarily used for representation purposes where the style of the map matters to us, where the theme of the map also is taken into consideration. CartoDB’s Positron and Dark Matter both do the same thing but give us different background themes and font colors.
Let us write these commands:
first_map = folium.Map(location=[18.922064, 72.834641],zoom_start=24,tiles='cartodbpositron')
Output:

first_map = folium.Map(location=[18.922064, 72.834641],zoom_start=24,tiles='cartodbdark_matter')
Output:

On concluding today’s tutorial you all can say that now, you are well versed on how to handle geospatial data and how can one create maps using these data points with the help of Python’s Folium library.
Leave a Reply